


NIH Institutes & Centers Workforce Demographics
In pursuing the advancement of equity within the NIH workforce, we know that the journey begins with transparency. The ongoing analysis of workforce data allows us to tell the story of the people here at NIH who work to advance biomedical research. The Institute and Center (IC) workforce profiles below describe the demographic composition of each IC’s workforce, and can be utilized to investigate potential disparities which may present barriers to equity in employment opportunities.
NIH Institutes & Centers
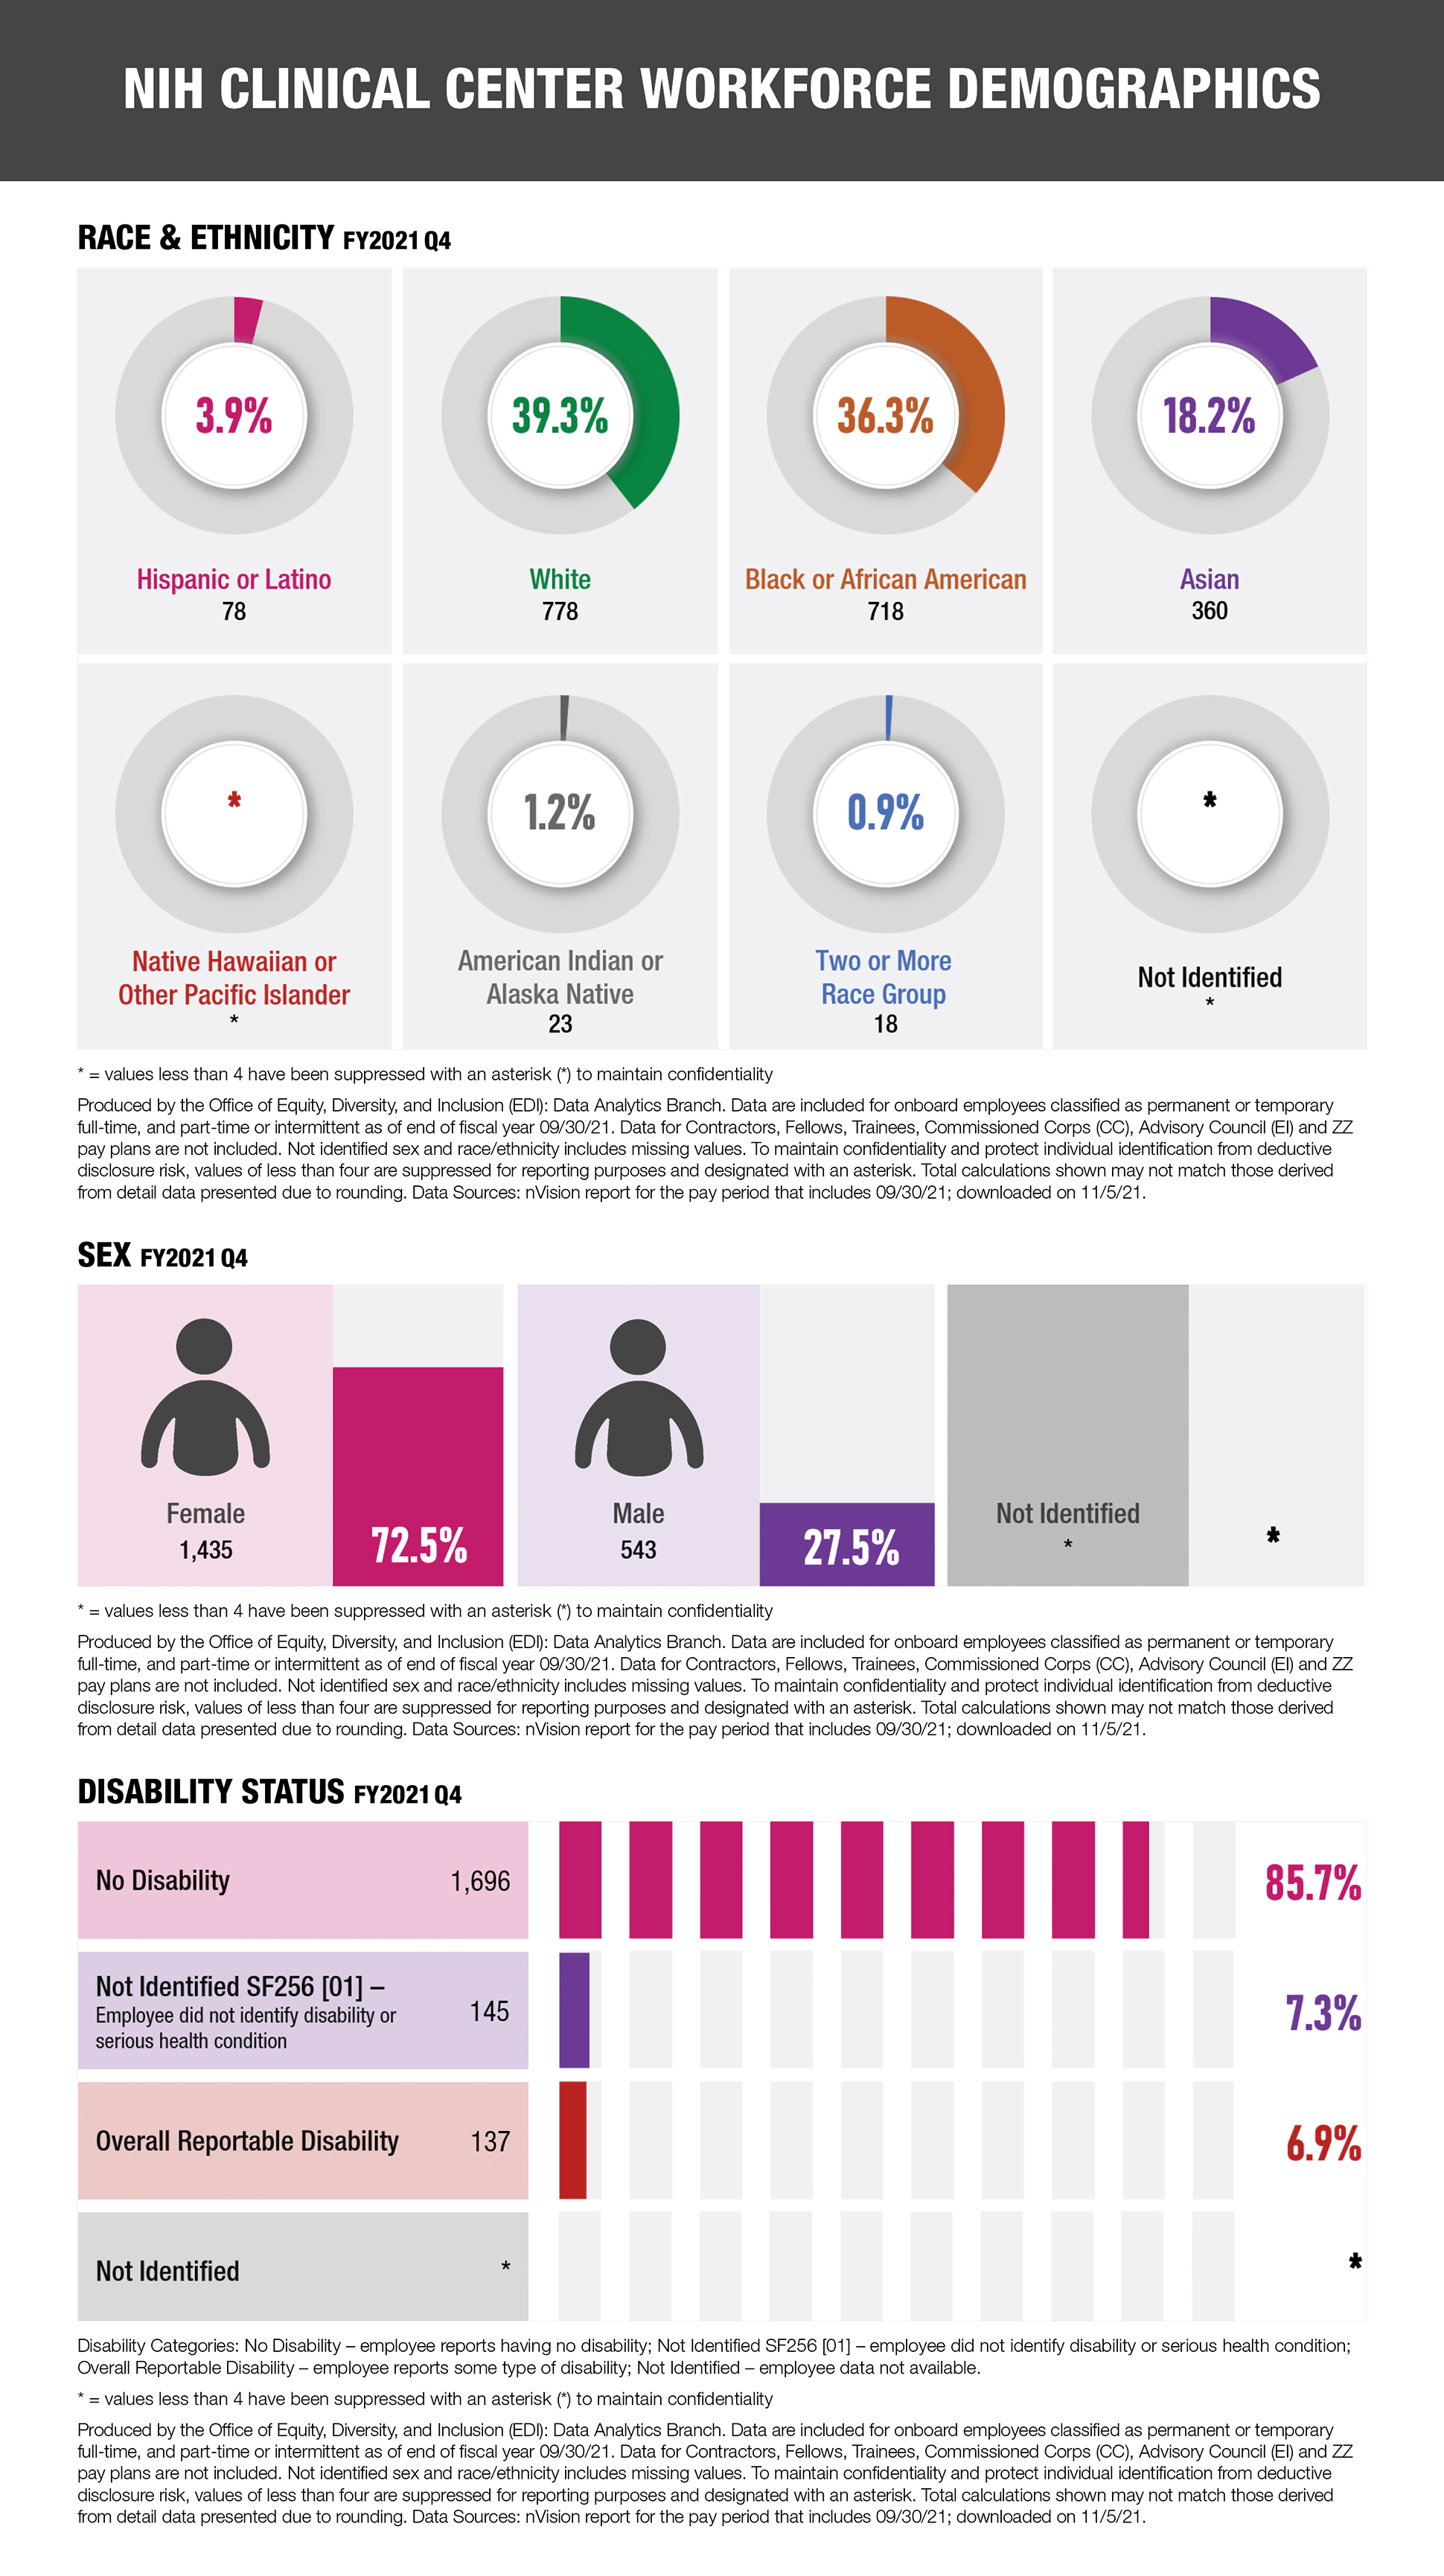
National Institutes of Health Clinical Center Workforce Demographics
Three graphs representing data for the National Institutes of Health Clinical Center Workforce Demographics for FY2021 Q4.
First graph showing race and ethnicity by total and percentage: Hispanic or Latino = 78 and 3.9%; White = 778 and 39.3%; Black or African American = 718 and 36.3%; Asian = 360 and 18.2%; Native Hawaiian or Pacific Islander = * and *; American Indian or Alaska Native = 23 and 1.2%; Two or More Race Group = 18 and 0.9%; Not Identified = * and *%
Second graph showing sex by total and percentage: Female = 1,435 and 72.5%; Male = 543 and 27.5%; Not Identified = * and *%
Third graph showing disability status by total and percentage: No disability = 1,696 and 85.7%; Not Identified SF256 [01] – employee did not identify disability or serious health condition= 145 and 7.3%; Overall Reportable Disability = 137 and 6.9%; Not Identified = * and *%
For all graphs: * = values less than 4 have been suppressed with an asterisk (*) to maintain confidentiality
All graphs are produced by the Office of Equity, Diversity, and Inclusion (EDI): Data Analytics Branch. Data are included for onboard employees classified as permanent or temporary full-time, and part-time or intermittent as of end of fiscal year 09/30/21. Data for Contractors, Fellows, Trainees, Commissioned Corps (CC), Advisory Council (EI) and ZZ pay plans are not included. Not identified sex and race/ethnicity includes missing values. To maintain confidentiality and protect individual identification from deductive disclosure risk, values of less than four are suppressed for reporting purposes and designated with an asterisk. Total calculations shown may not match those derived from detail data presented due to rounding. Data Sources: nVision report for the pay period that includes 09/30/21; downloaded on 11/5/21.
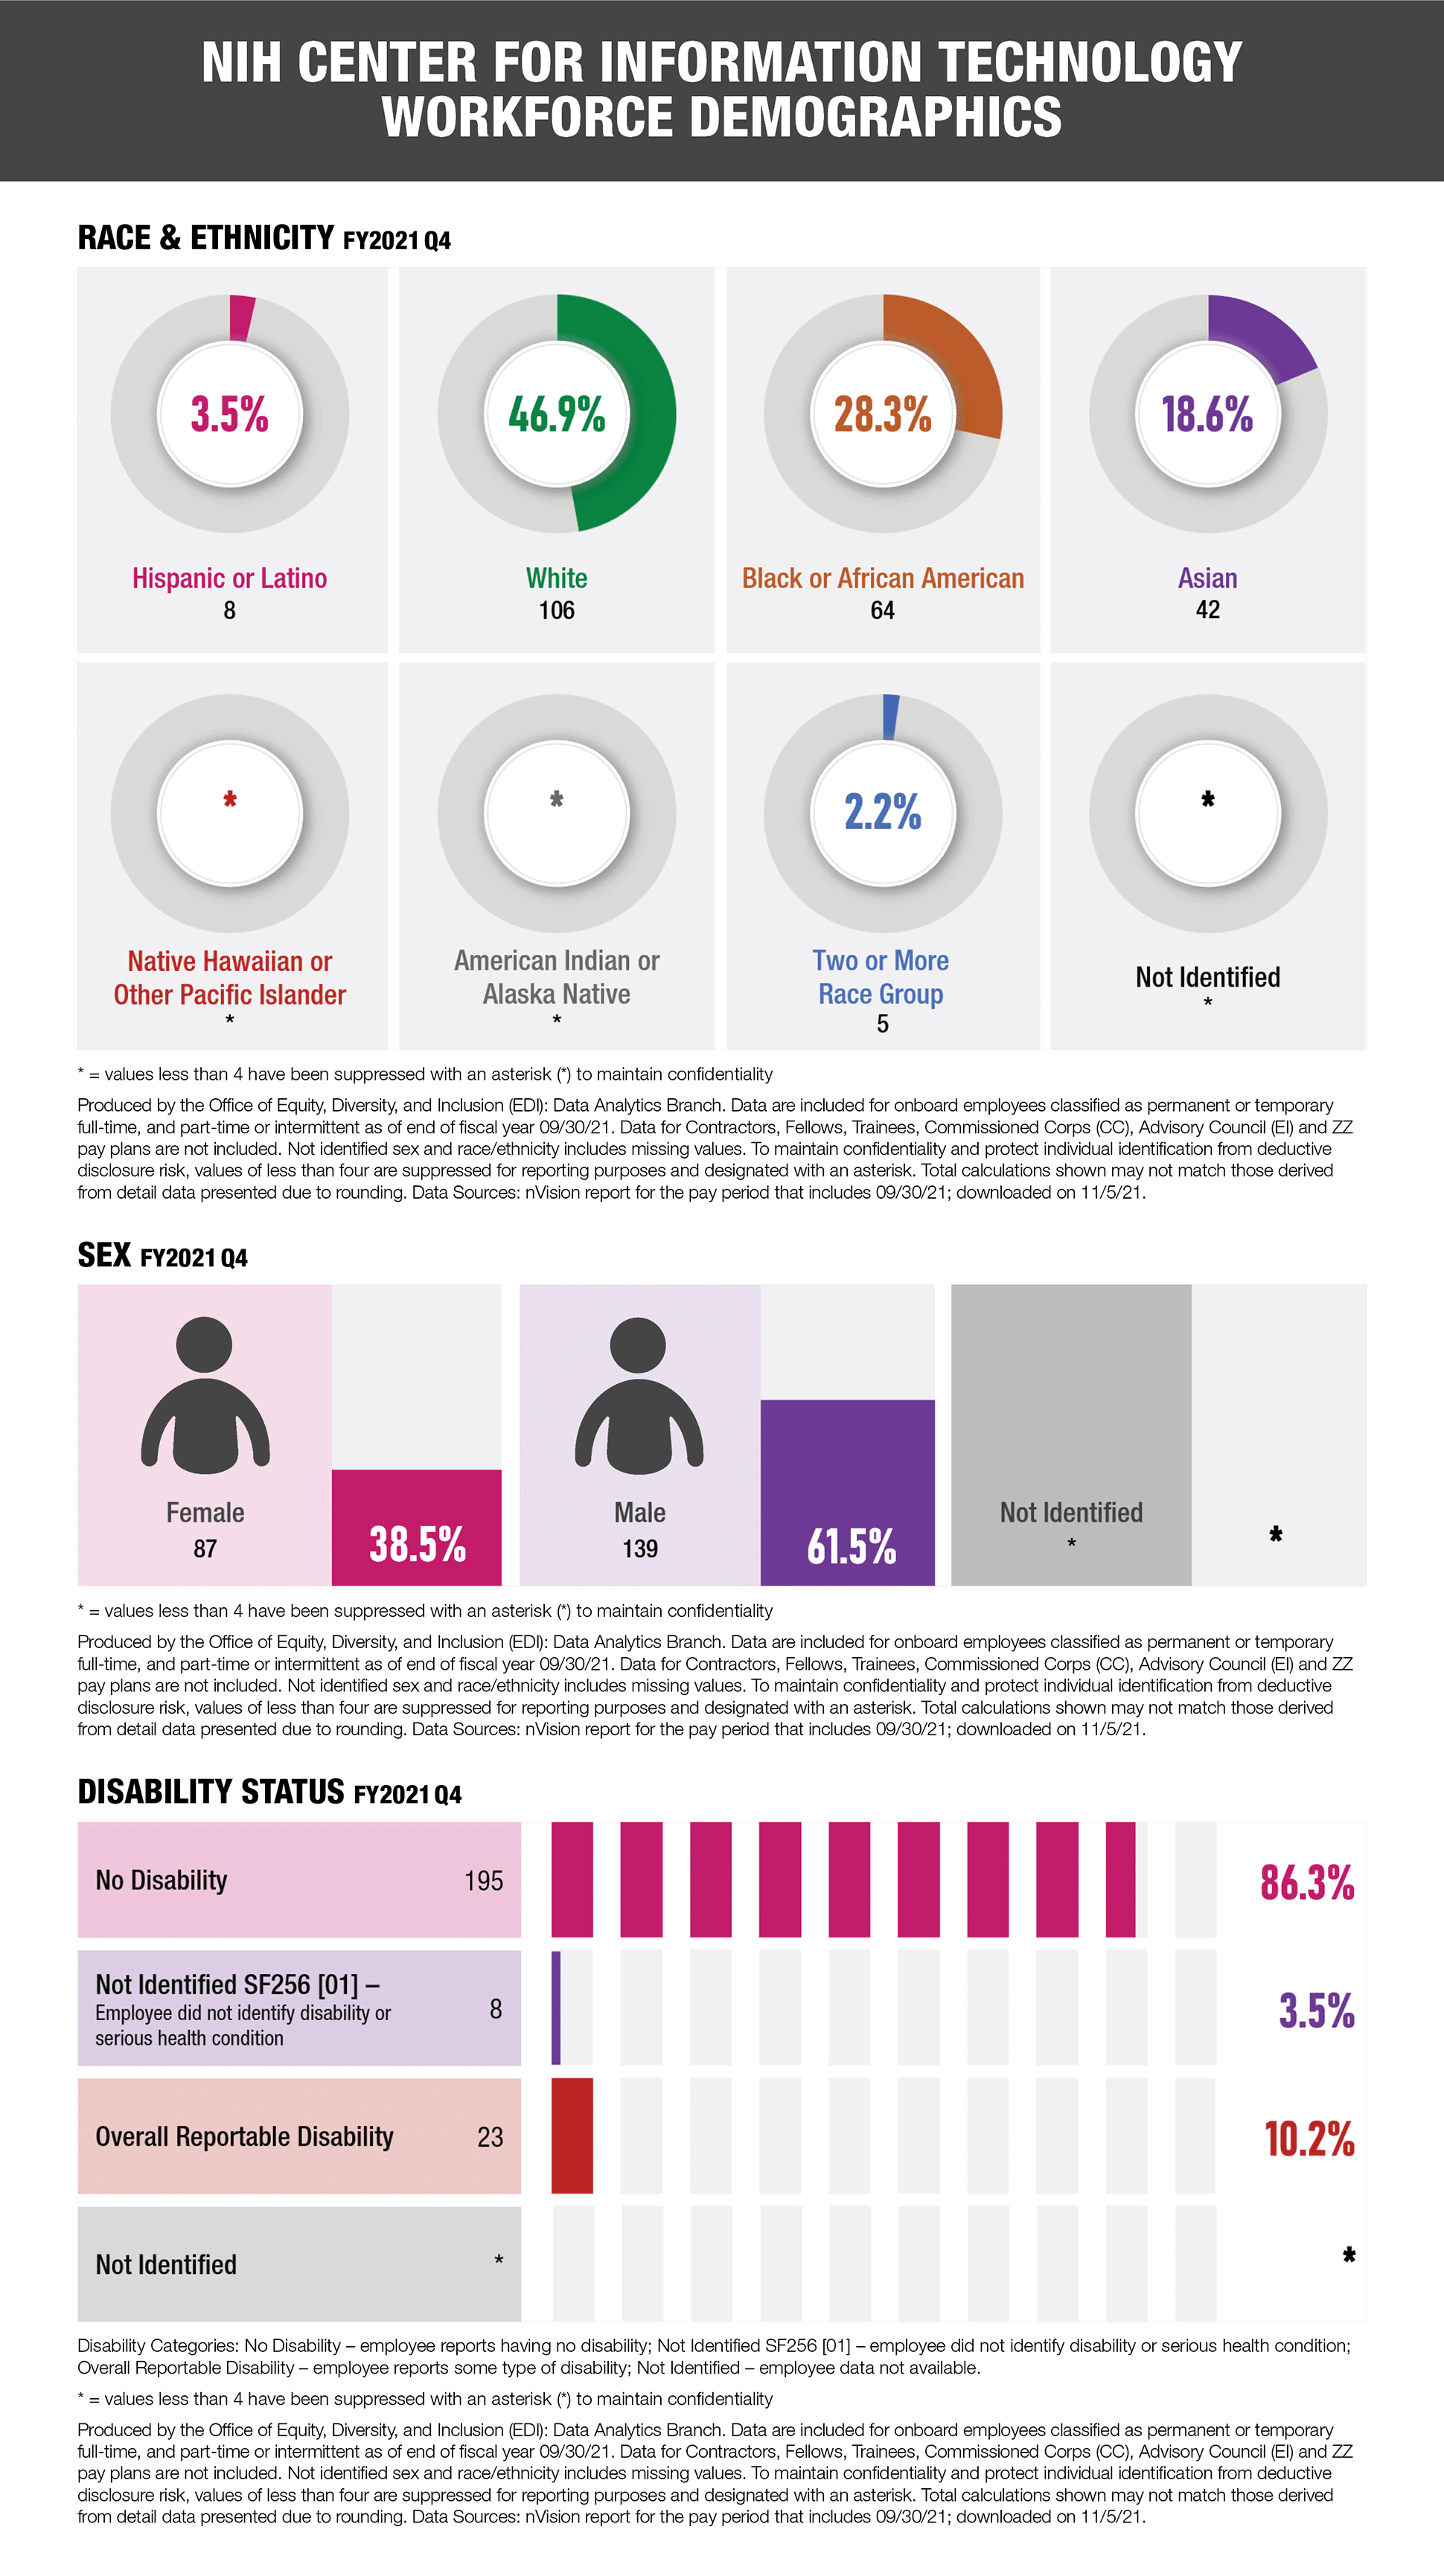
National Institutes of Health Center for Information Technology Workforce Demographics
Three graphs representing data for the National Institutes of Health Center for Information Technology Workforce Demographics for FY2021 Q4.
First graph showing race and ethnicity: Hispanic or Latino = 8 and 3.5%; White = 106 and 46.9%; Black or African American = 64 and 28.3%; Asian = 42 and 18.6%; Native Hawaiian or Pacific Islander = * and *%; American Indian or Alaska Native = * and *%; Two or More Race Group = 5 and 2.2%; Not Identified = * and *%
Second graph showing Sex: Female = 87 and 38.5%; Male = 139 and 61.5%; Not Identified = * and *%
Third graph showing disability status: No disability = 195 and 86.3%; Not Identified SF256 [01] – employee did not identify disability or serious health condition= 8 and 3.5%; Overall Reportable Disability = 23 and 10.2%; Not Identified = * and *%
For all graphs: * = values less than 4 have been suppressed with an asterisk (*) to maintain confidentiality
All graphs are produced by the Office of Equity, Diversity, and Inclusion (EDI): Data Analytics Branch. Data are included for onboard employees classified as permanent or temporary full-time, and part-time or intermittent as of end of fiscal year 09/30/21. Data for Contractors, Fellows, Trainees, Commissioned Corps (CC), Advisory Council (EI) and ZZ pay plans are not included. Not identified sex and race/ethnicity includes missing values. To maintain confidentiality and protect individual identification from deductive disclosure risk, values of less than four are suppressed for reporting purposes and designated with an asterisk. Total calculations shown may not match those derived from detail data presented due to rounding. Data Sources: nVision report for the pay period that includes 09/30/21; downloaded on 11/5/21.
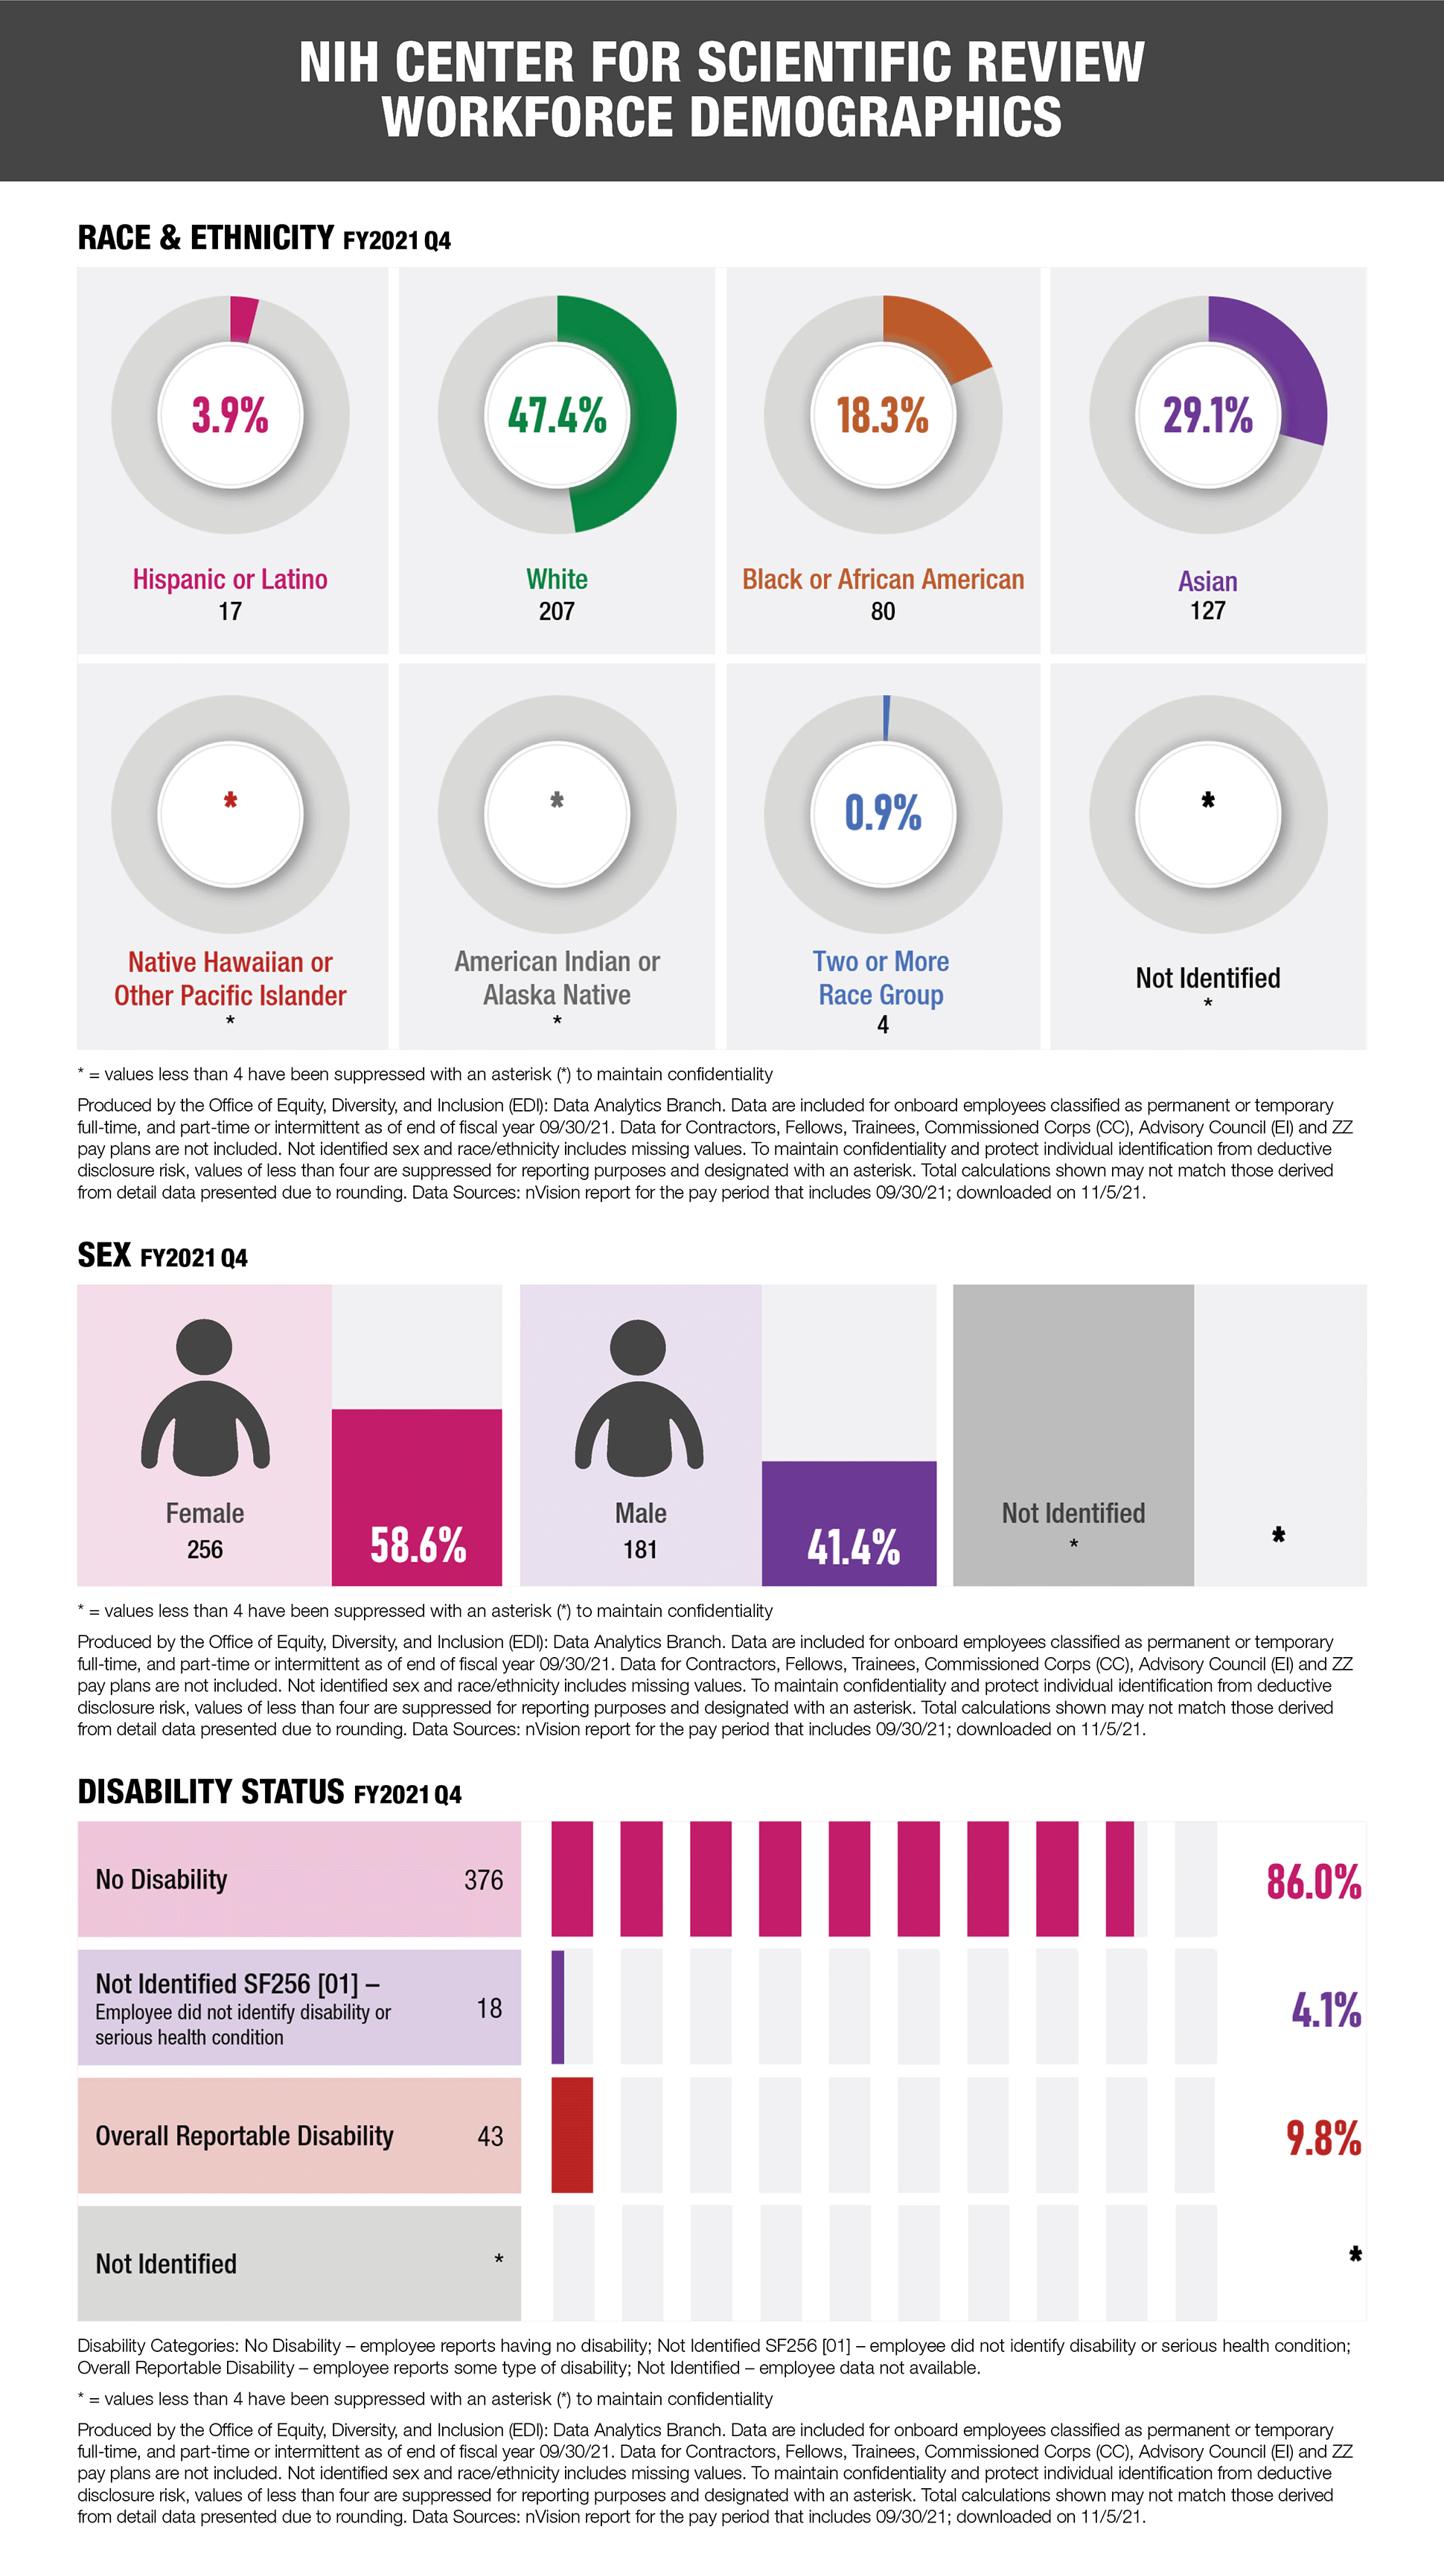
National Institutes of Health Center for Scientific Review Workforce Demographics
Three graphs representing data for the National Institutes of Health Center for Scientific Review Workforce Demographics for FY2021 Q4.
First graph showing race and ethnicity: Hispanic or Latino = 17 and 3.9%; White = 207 and 47.4%; Black or African American = 80 and 18.3%; Asian = 127 and 29.1%; Native Hawaiian or Pacific Islander = * and *%; American Indian or Alaska Native = * and *%; Two or More Race Group = 4 and 0.9%; Not Identified = * and *%
Second graph showing Sex: Female = 256 and 58.6%; Male = 181 and 41.4%; Not Identified = * and *%
Third graph showing disability status: No disability = 376 and 86.0%; Not Identified SF256 [01] – employee did not identify disability or serious health condition= 18 and 4.1%; Overall Reportable Disability = 43 and 9.8%; Not Identified = * and *%
For all graphs: * = values less than 4 have been suppressed with an asterisk (*) to maintain confidentiality
All graphs are produced by the Office of Equity, Diversity, and Inclusion (EDI): Data Analytics Branch. Data are included for onboard employees classified as permanent or temporary full-time, and part-time or intermittent as of end of fiscal year 09/30/21. Data for Contractors, Fellows, Trainees, Commissioned Corps (CC), Advisory Council (EI) and ZZ pay plans are not included. Not identified sex and race/ethnicity includes missing values. To maintain confidentiality and protect individual identification from deductive disclosure risk, values of less than four are suppressed for reporting purposes and designated with an asterisk. Total calculations shown may not match those derived from detail data presented due to rounding. Data Sources: nVision report for the pay period that includes 09/30/21; downloaded on 11/5/21.
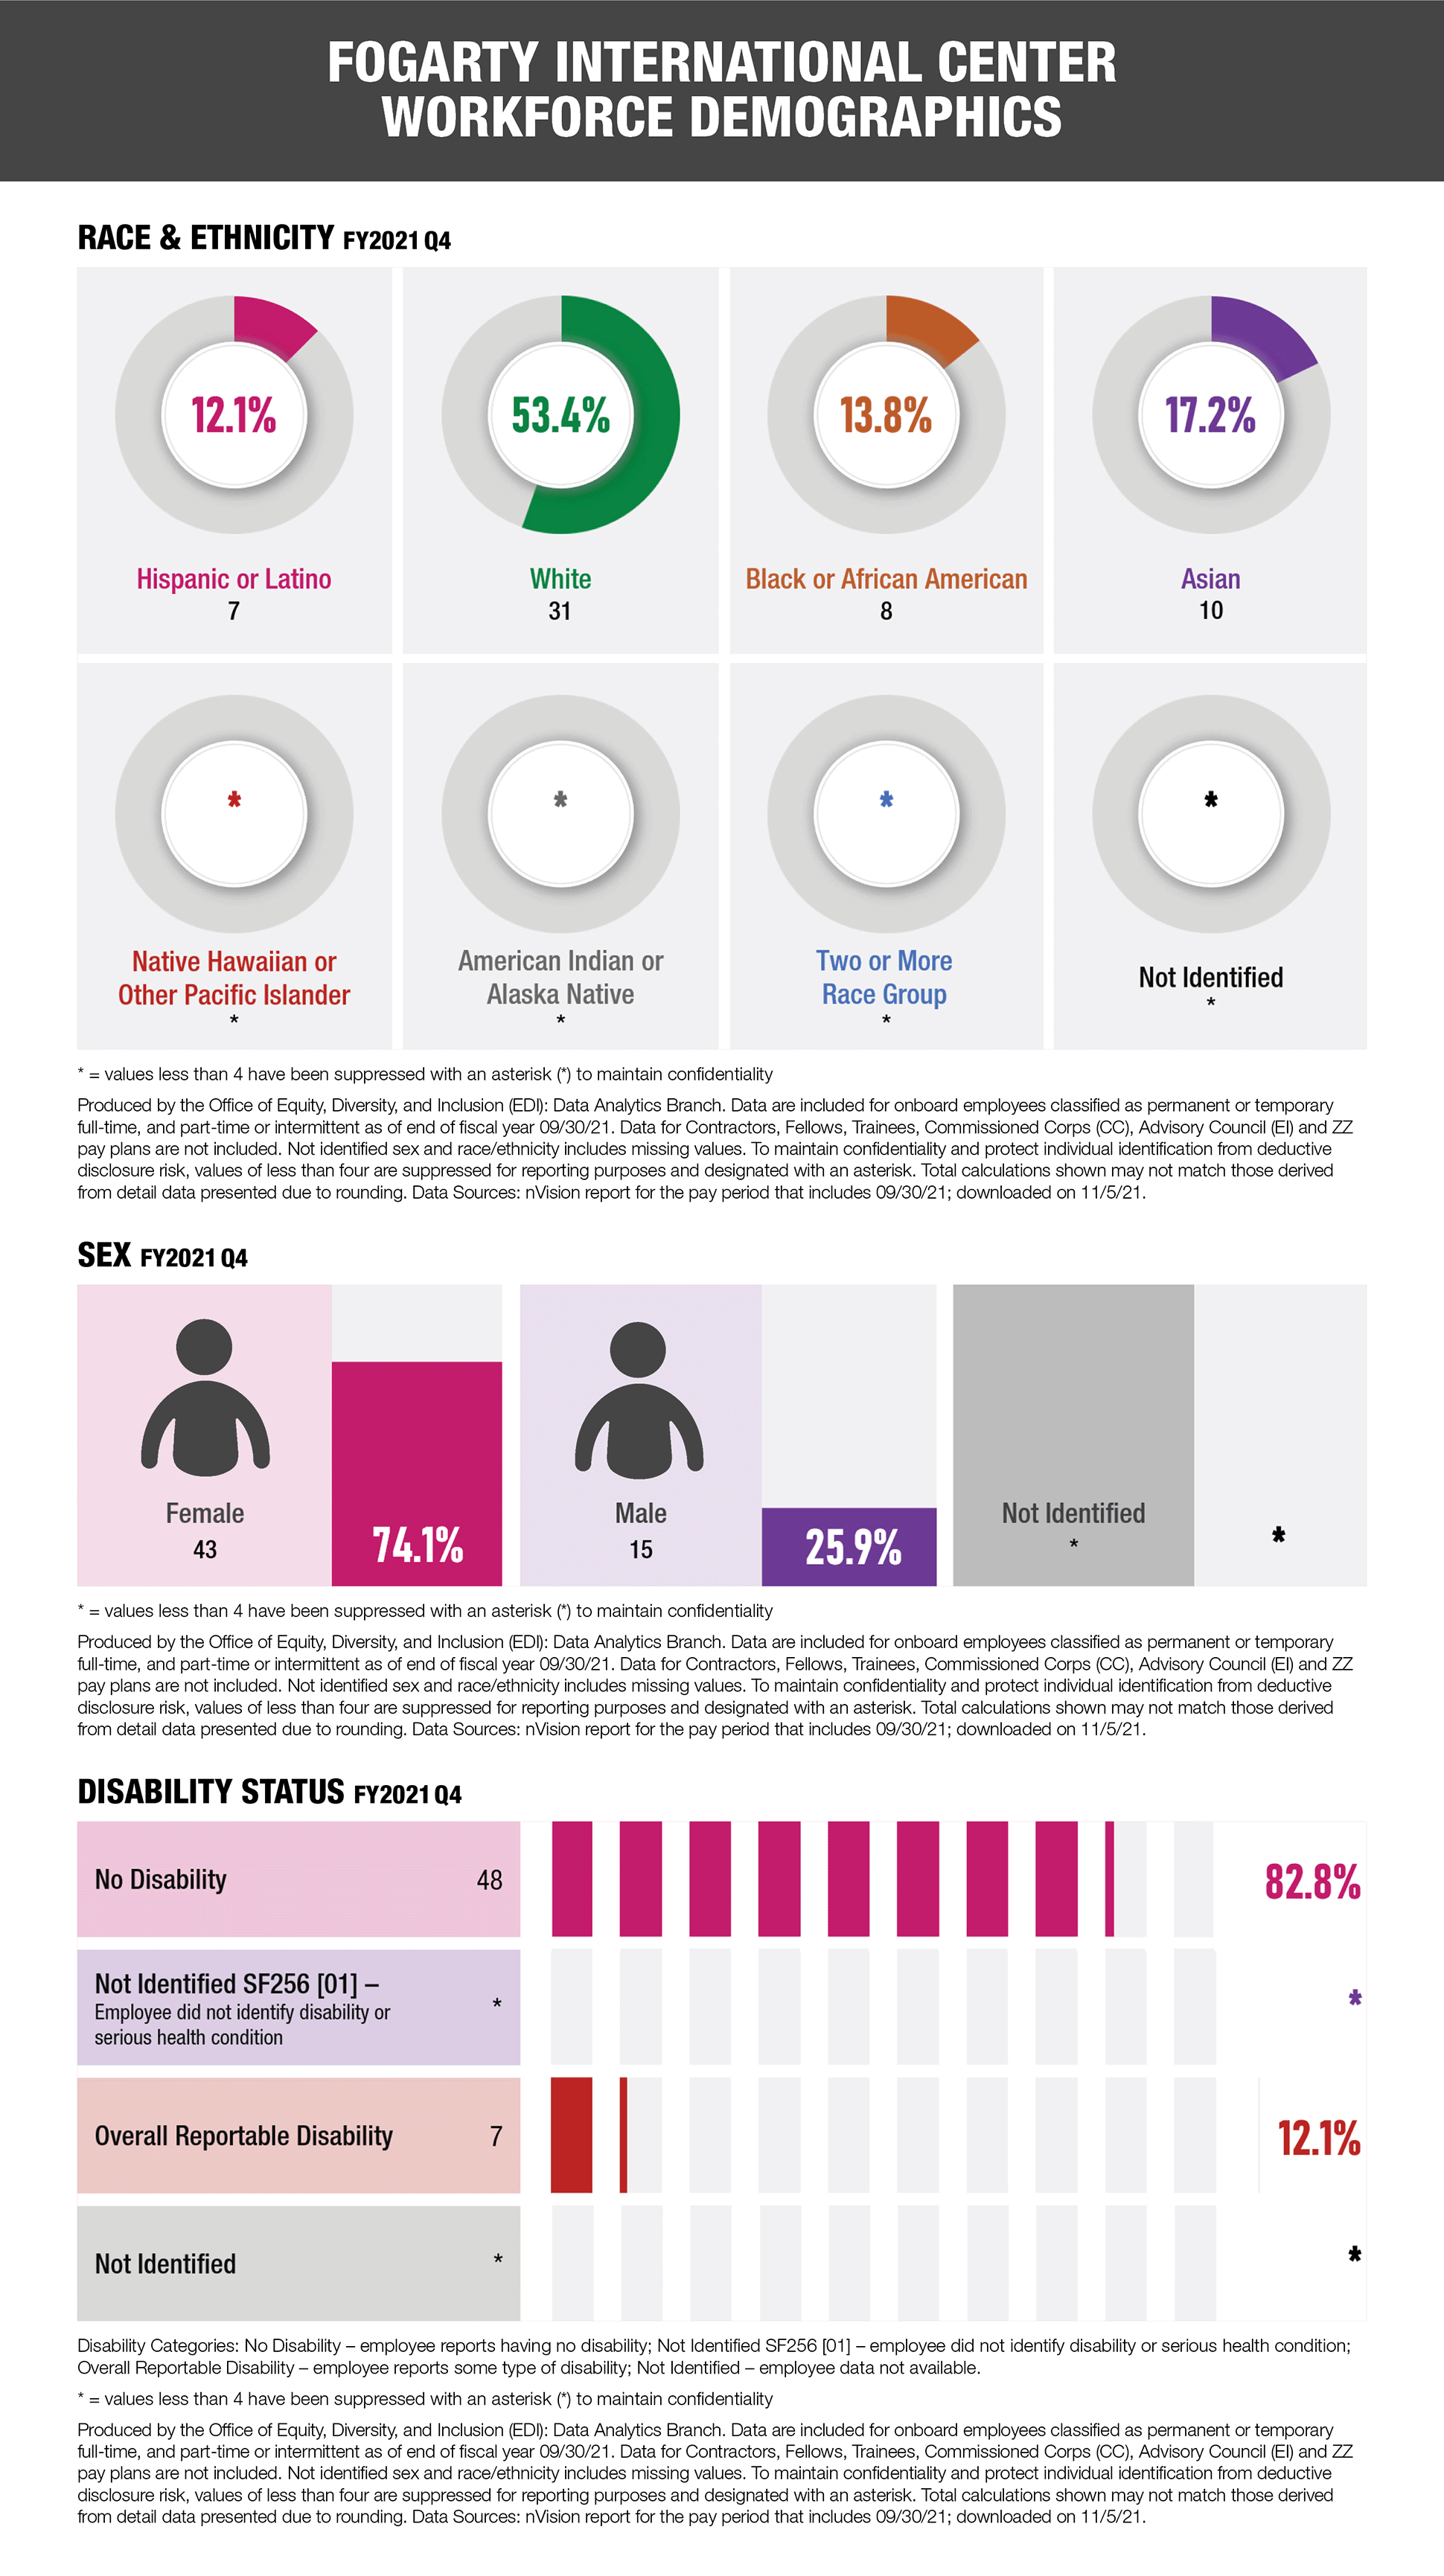
Fogarty International Center Workforce Demographics
Three graphs representing data for the Fogarty International Center Workforce Demographics for FY2021 Q4.
First graph showing race and ethnicity: Hispanic or Latino = 7 and 12.1%; White = 31 and 53.4%; Black or African American = 8 and 13.8%; Asian = 10 and 17.2%; Native Hawaiian or Pacific Islander = * and *%; American Indian or Alaska Native = * and *%; Two or More Race Group = * and *%; Not Identified = * and *%
Second graph showing Sex: Female = 43 and 74.1%; Male = 15 and 25.9%; Not Identified = * and *%
Third graph showing disability status: No disability = 48 and 82.8%; Not Identified SF256 [01] – employee did not identify disability or serious health condition= * and *%; Overall Reportable Disability = 7 and 12.1%; Not Identified = * and *%
For all graphs: * = values less than 4 have been suppressed with an asterisk (*) to maintain confidentiality
All graphs are produced by the Office of Equity, Diversity, and Inclusion (EDI): Data Analytics Branch. Data are included for onboard employees classified as permanent or temporary full-time, and part-time or intermittent as of end of fiscal year 09/30/21. Data for Contractors, Fellows, Trainees, Commissioned Corps (CC), Advisory Council (EI) and ZZ pay plans are not included. Not identified sex and race/ethnicity includes missing values. To maintain confidentiality and protect individual identification from deductive disclosure risk, values of less than four are suppressed for reporting purposes and designated with an asterisk. Total calculations shown may not match those derived from detail data presented due to rounding. Data Sources: nVision report for the pay period that includes 09/30/21; downloaded on 11/5/21.

National Center for Advancing Translational Sciences Workforce Demographics
Three graphs representing data for the National Center for Advancing Translational Sciences Workforce Demographics for FY2021 Q4.
First graph showing race and ethnicity: Hispanic or Latino = 14 and 5.6%; White = 133 and 53.2%; Black or African American = 33 and 13.2%; Asian = 64 and 25.6%; Native Hawaiian or Pacific Islander = * and *%; American Indian or Alaska Native = * and *%; Two or More Race Group = * and *%; Not Identified = * and *%
Second graph showing Sex: Female = 147 and 58.8%; Male = 103 and 41.2%; Not Identified = * and *%
Third graph showing disability status: No disability = 212 and 84.8%; Not Identified SF256 [01] – employee did not identify disability or serious health condition= 18 and 7.2%; Overall Reportable Disability = 20 and 8.0%; Not Identified = * and *%
For all graphs: * = values less than 4 have been suppressed with an asterisk (*) to maintain confidentiality
All graphs are produced by the Office of Equity, Diversity, and Inclusion (EDI): Data Analytics Branch. Data are included for onboard employees classified as permanent or temporary full-time, and part-time or intermittent as of end of fiscal year 09/30/21. Data for Contractors, Fellows, Trainees, Commissioned Corps (CC), Advisory Council (EI) and ZZ pay plans are not included. Not identified sex and race/ethnicity includes missing values. To maintain confidentiality and protect individual identification from deductive disclosure risk, values of less than four are suppressed for reporting purposes and designated with an asterisk. Total calculations shown may not match those derived from detail data presented due to rounding. Data Sources: nVision report for the pay period that includes 09/30/21; downloaded on 11/5/21.
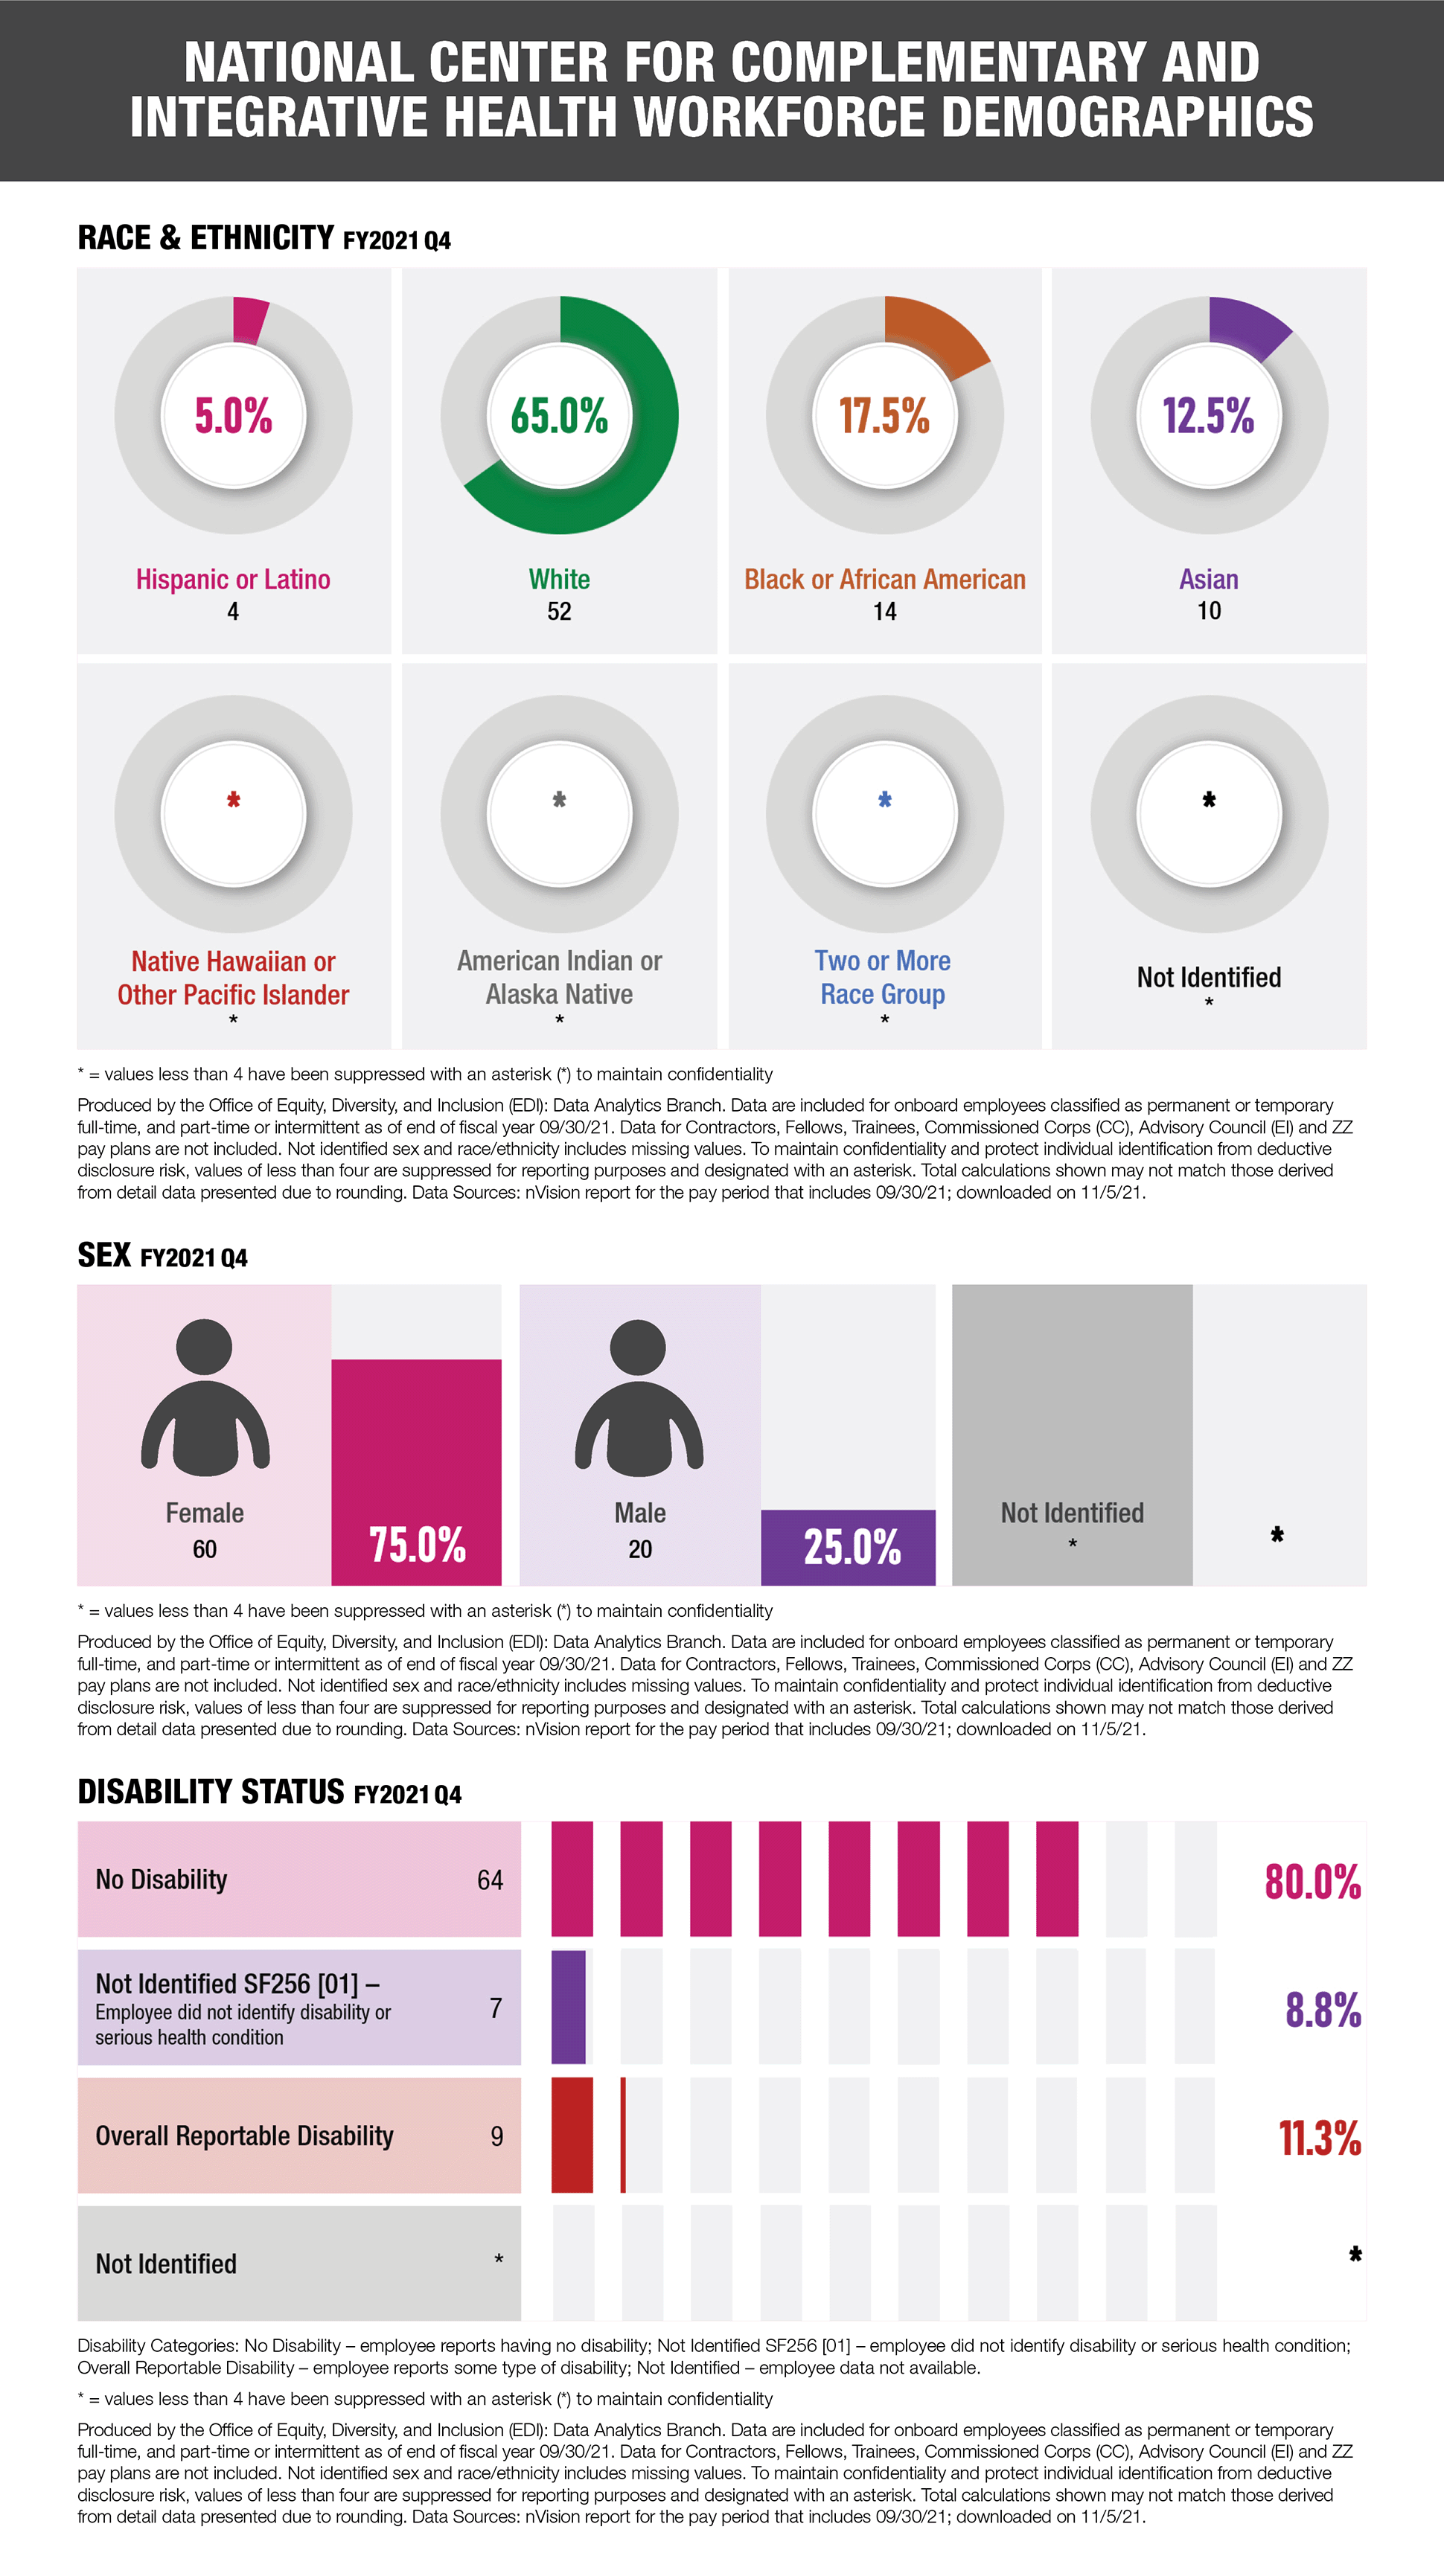
National Center for Complementary and Integrative Health Workforce Demographics
Three graphs representing data for the National Center for Complementary and Integrative Health Workforce Demographics for FY2021 Q4.
First graph showing race and ethnicity: Hispanic or Latino = 4 and 5.0%; White = 52 and 65.0%; Black or African American = 14 and 17.5%; Asian = 10 and 12.5%; Native Hawaiian or Pacific Islander = * and *%; American Indian or Alaska Native = * and *%; Two or More Race Group = * and *%; Not Identified = * and *%
Second graph showing Sex: Female = 60 and 75.0%; Male = 20 and 25.0%; Not Identified = * and *%
Third graph showing disability status: No disability = 64 and 80.0%; Not Identified SF256 [01] – employee did not identify disability or serious health condition= 7 and 8.8%; Overall Reportable Disability = 9 and 11.3%; Not Identified = * and *%
For all graphs: * = values less than 4 have been suppressed with an asterisk (*) to maintain confidentiality
All graphs are produced by the Office of Equity, Diversity, and Inclusion (EDI): Data Analytics Branch. Data are included for onboard employees classified as permanent or temporary full-time, and part-time or intermittent as of end of fiscal year 09/30/21. Data for Contractors, Fellows, Trainees, Commissioned Corps (CC), Advisory Council (EI) and ZZ pay plans are not included. Not identified sex and race/ethnicity includes missing values. To maintain confidentiality and protect individual identification from deductive disclosure risk, values of less than four are suppressed for reporting purposes and designated with an asterisk. Total calculations shown may not match those derived from detail data presented due to rounding. Data Sources: nVision report for the pay period that includes 09/30/21; downloaded on 11/5/21.

National Cancer Institute Workforce Demographics
Three graphs representing data for the National Cancer Institute Workforce Demographics for FY2021 Q4.
First graph showing race and ethnicity: Hispanic or Latino = 120 and 3.8%; White = 1,796 and 56.8%; Black or African American = 412 and 13.0%; Asian = 797 and 25.2%; Native Hawaiian or Pacific Islander = * and *%; American Indian or Alaska Native = 9 and 0.3%; Two or More Race Group = 27 and 0.9%; Not Identified = * and *%
Second graph showing Sex: Female = 1,900 and 60.1%; Male = 1,261 and 39.9%; Not Identified = * and *%
Third graph showing disability status: No disability = 2,709 and 85.7%; Not Identified SF256 [01] – employee did not identify disability or serious health condition= 196 and 6.2%; Overall Reportable Disability = 256 and 8.1%; Not Identified = * and *%
For all graphs: * = values less than 4 have been suppressed with an asterisk (*) to maintain confidentiality
All graphs are produced by the Office of Equity, Diversity, and Inclusion (EDI): Data Analytics Branch. Data are included for onboard employees classified as permanent or temporary full-time, and part-time or intermittent as of end of fiscal year 09/30/21. Data for Contractors, Fellows, Trainees, Commissioned Corps (CC), Advisory Council (EI) and ZZ pay plans are not included. Not identified sex and race/ethnicity includes missing values. To maintain confidentiality and protect individual identification from deductive disclosure risk, values of less than four are suppressed for reporting purposes and designated with an asterisk. Total calculations shown may not match those derived from detail data presented due to rounding. Data Sources: nVision report for the pay period that includes 09/30/21; downloaded on 11/5/21.

National Eye Institute Workforce Demographics
Three graphs representing data for the National Eye Institute Workforce Demographics for FY2021 Q4.
First graph showing race and ethnicity: Hispanic or Latino = 22 and 7.6%; White = 136 and 46.7%; Black or African American = 48 and 16.5%; Asian = 80 and 27.5%; Native Hawaiian or Pacific Islander = * and *%; American Indian or Alaska Native = * and *%; Two or More Race Group = * and *%; Not Identified = * and *%
Second graph showing Sex: Female = 158 and 54.3%; Male = 133 and 45.7%; Not Identified = * and *%
Third graph showing disability status: No disability = 230 and 79.0%; Not Identified SF256 [01] – employee did not identify disability or serious health condition= 31 and 10.7%; Overall Reportable Disability = 30 and 10.3%; Not Identified = * and *%
For all graphs: * = values less than 4 have been suppressed with an asterisk (*) to maintain confidentiality
All graphs are produced by the Office of Equity, Diversity, and Inclusion (EDI): Data Analytics Branch. Data are included for onboard employees classified as permanent or temporary full-time, and part-time or intermittent as of end of fiscal year 09/30/21. Data for Contractors, Fellows, Trainees, Commissioned Corps (CC), Advisory Council (EI) and ZZ pay plans are not included. Not identified sex and race/ethnicity includes missing values. To maintain confidentiality and protect individual identification from deductive disclosure risk, values of less than four are suppressed for reporting purposes and designated with an asterisk. Total calculations shown may not match those derived from detail data presented due to rounding. Data Sources: nVision report for the pay period that includes 09/30/21; downloaded on 11/5/21.
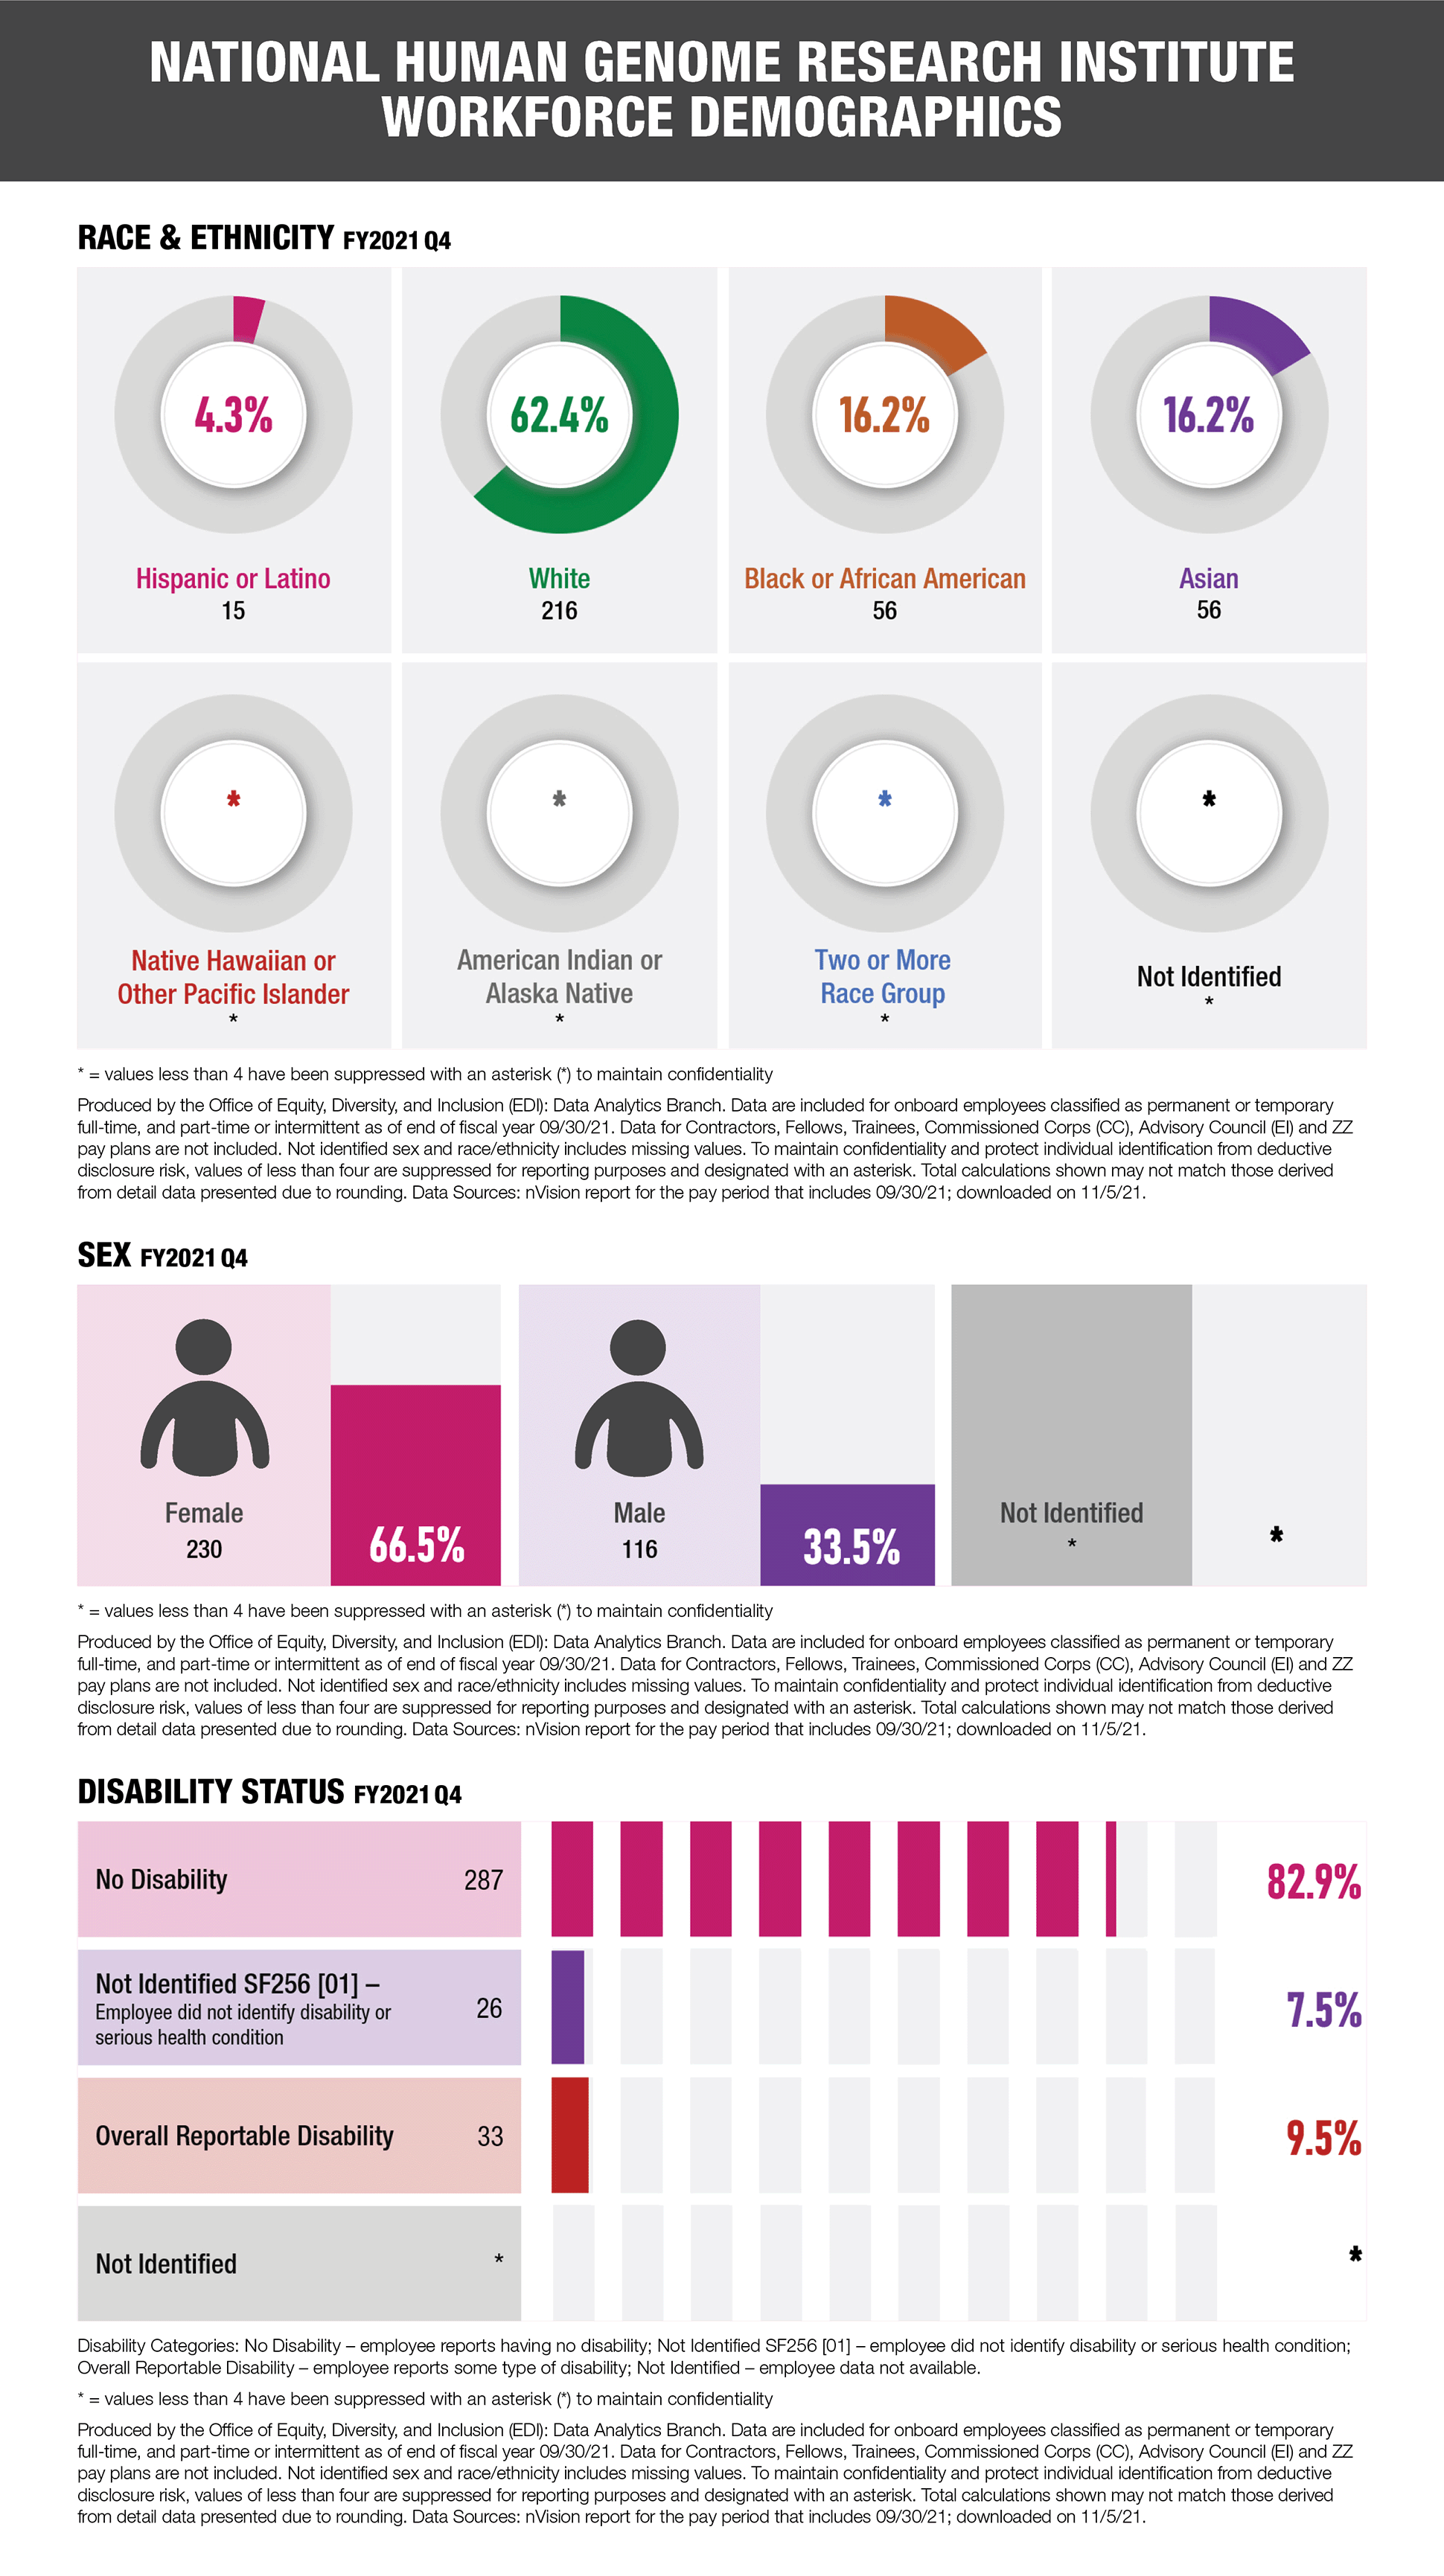
National Human Genome Research Institute Workforce Demographics
Three graphs representing data for the National Human Genome Research Institute Workforce Demographics for FY2021 Q4.
First graph showing race and ethnicity: Hispanic or Latino = 15 and 4.3%; White = 216 and 62.4%; Black or African American = 56 and 16.2%; Asian = 56 and 16.2%; Native Hawaiian or Pacific Islander = * and *%; American Indian or Alaska Native = * and *%; Two or More Race Group = * and *%; Not Identified = * and *%
Second graph showing Sex: Female = 230 and 66.5%; Male = 116 and 33.5%; Not Identified = * and *%
Third graph showing disability status: No disability = 287 and 82.9%; Not Identified SF256 [01] – employee did not identify disability or serious health condition= 26 and 7.5%; Overall Reportable Disability = 33 and 9.5%; Not Identified = * and *%
For all graphs: * = values less than 4 have been suppressed with an asterisk (*) to maintain confidentiality
All graphs are produced by the Office of Equity, Diversity, and Inclusion (EDI): Data Analytics Branch. Data are included for onboard employees classified as permanent or temporary full-time, and part-time or intermittent as of end of fiscal year 09/30/21. Data for Contractors, Fellows, Trainees, Commissioned Corps (CC), Advisory Council (EI) and ZZ pay plans are not included. Not identified sex and race/ethnicity includes missing values. To maintain confidentiality and protect individual identification from deductive disclosure risk, values of less than four are suppressed for reporting purposes and designated with an asterisk. Total calculations shown may not match those derived from detail data presented due to rounding. Data Sources: nVision report for the pay period that includes 09/30/21; downloaded on 11/5/21.
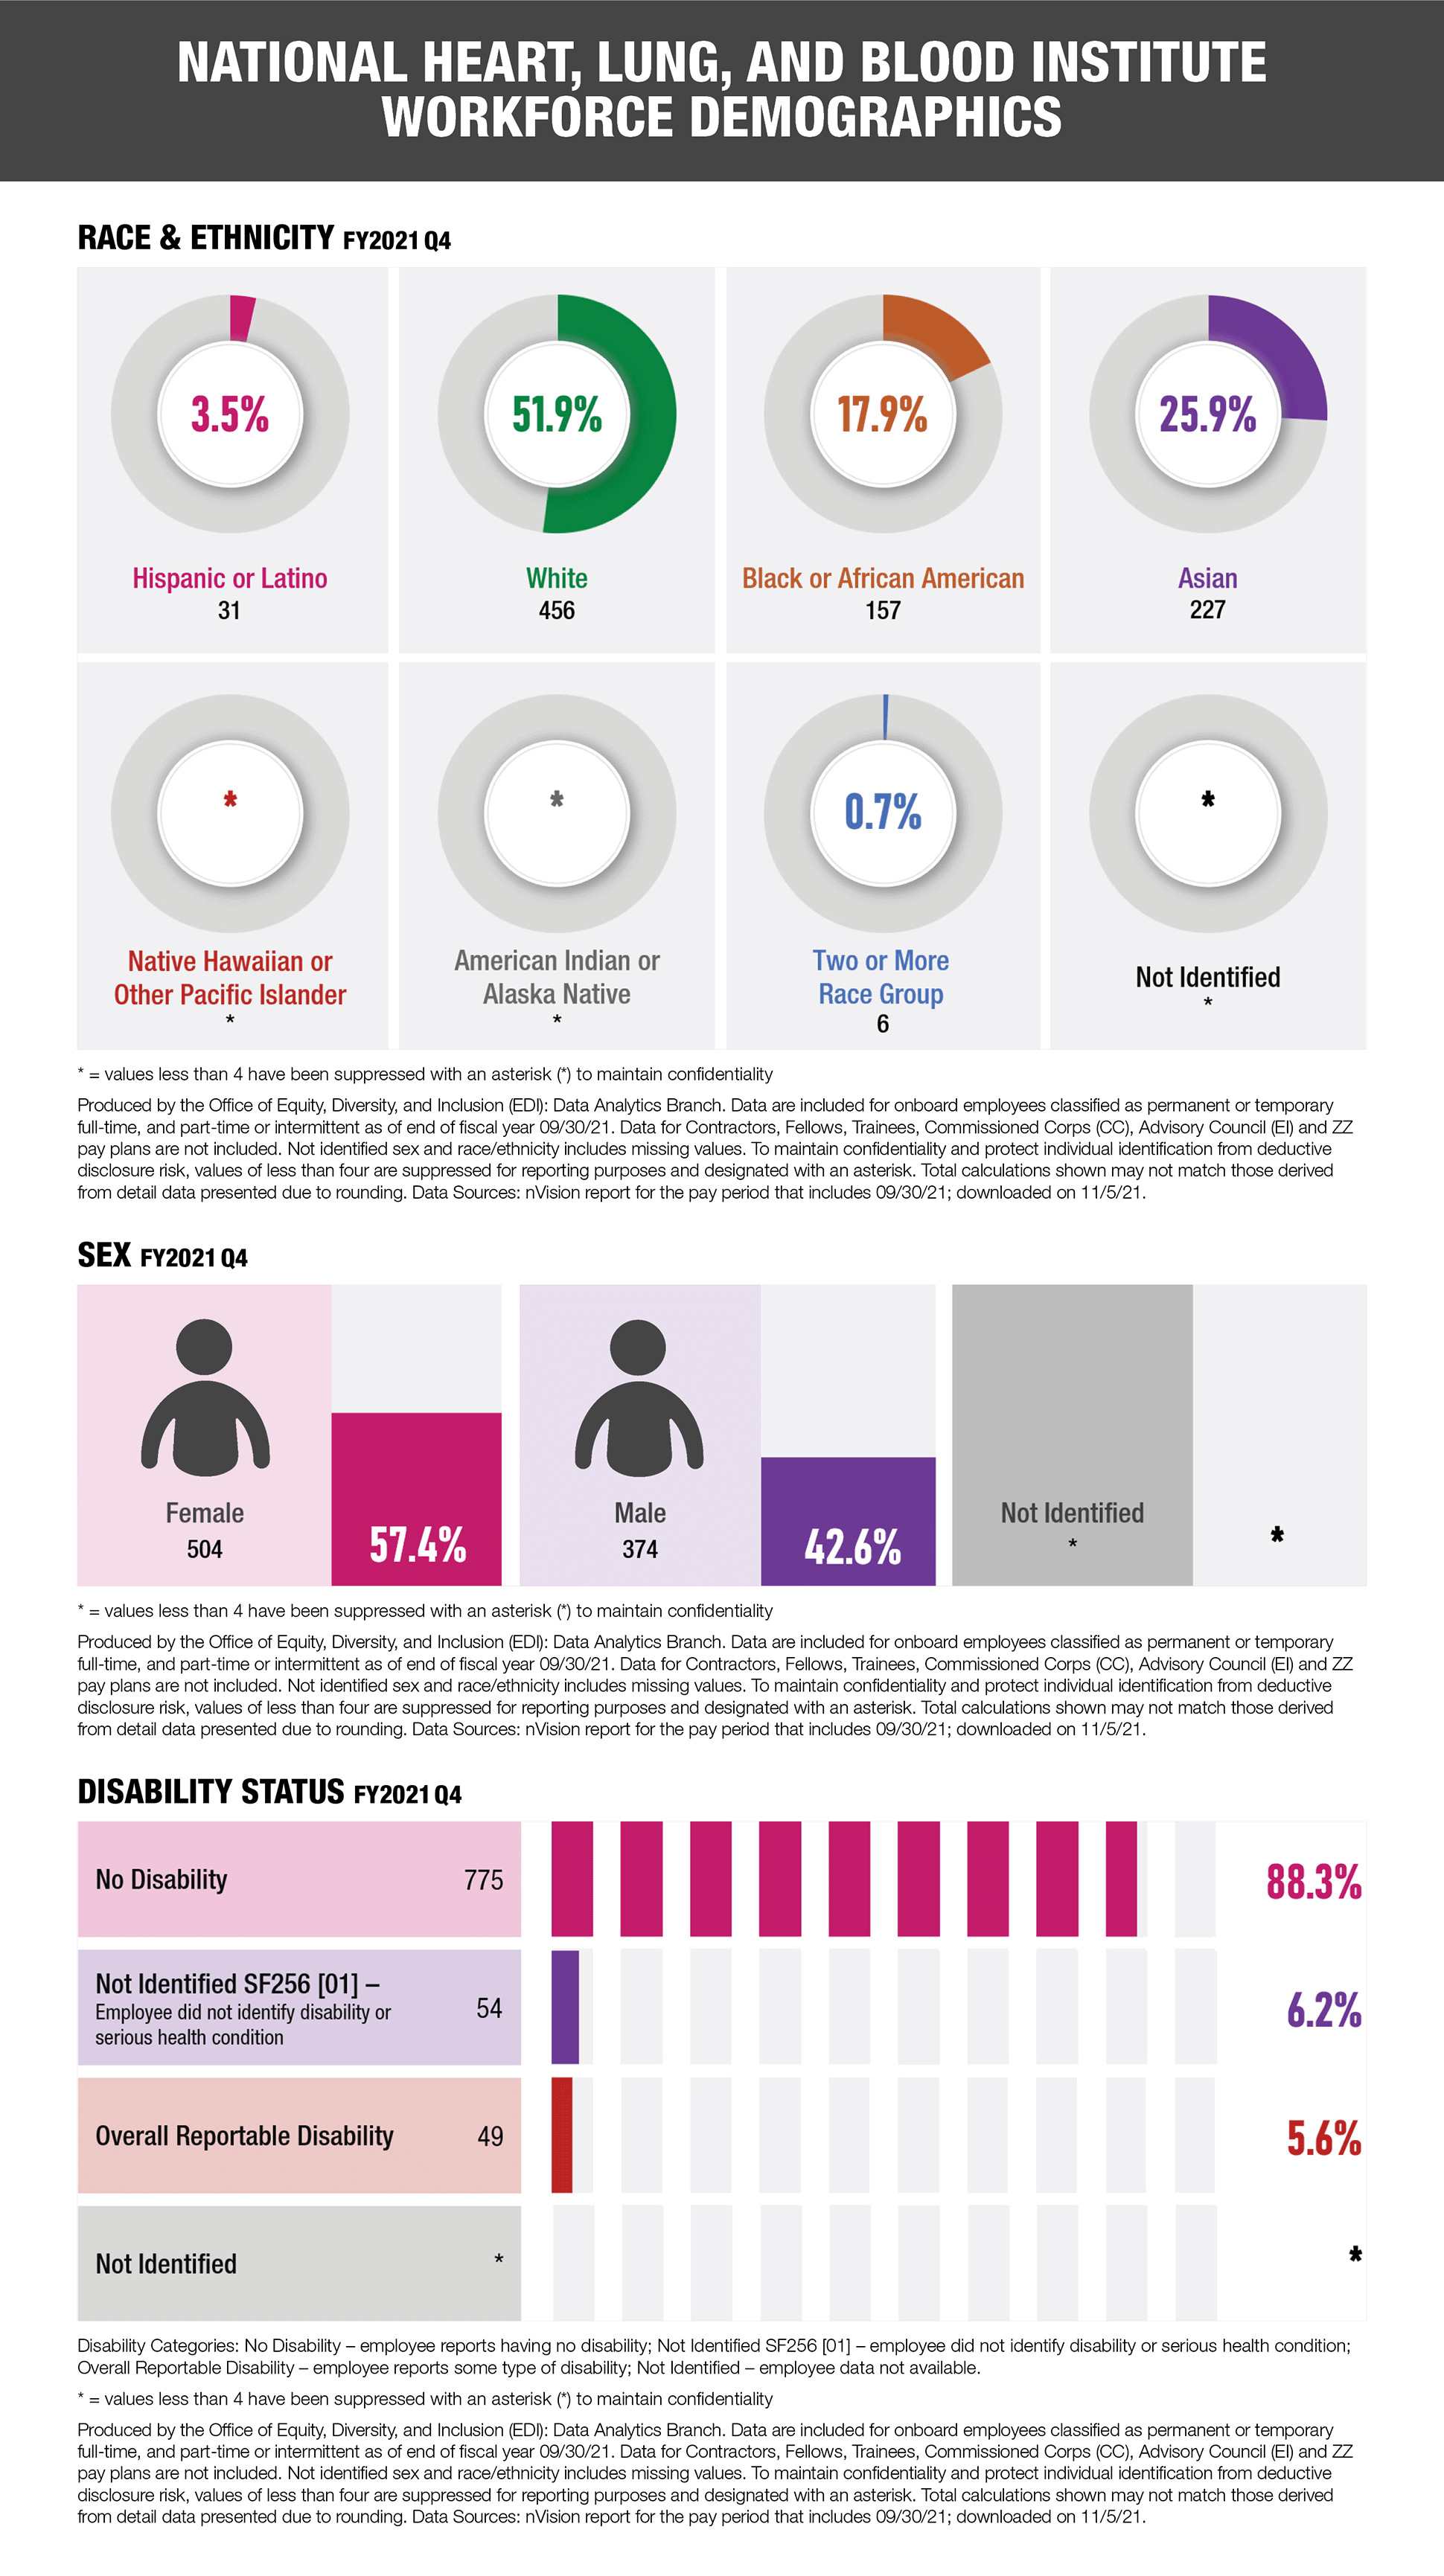
National Heart, Lung, and Blood Institute Workforce Demographics
Three graphs representing data for the National Heart, Lung, and Blood Institute Workforce Demographics for FY2021 Q4.
First graph showing race and ethnicity: Hispanic or Latino = 31 and 3.5%; White = 456 and 51.9%; Black or African American = 157 and 17.9%; Asian = 227 and 25.9%; Native Hawaiian or Pacific Islander = * and *%; American Indian or Alaska Native = * and *%; Two or More Race Group = 6 and 0.7%; Not Identified = * and *%
Second graph showing Sex: Female = 230 and 66.5%; Male = 116 and 33.5%; Not Identified = * and *%
Third graph showing disability status: No disability = 775 and 88.3%; Not Identified SF256 [01] – employee did not identify disability or serious health condition= 54 and 6.2%; Overall Reportable Disability = 49 and 5.6%; Not Identified = * and *%
For all graphs: * = values less than 4 have been suppressed with an asterisk (*) to maintain confidentiality
All graphs are produced by the Office of Equity, Diversity, and Inclusion (EDI): Data Analytics Branch. Data are included for onboard employees classified as permanent or temporary full-time, and part-time or intermittent as of end of fiscal year 09/30/21. Data for Contractors, Fellows, Trainees, Commissioned Corps (CC), Advisory Council (EI) and ZZ pay plans are not included. Not identified sex and race/ethnicity includes missing values. To maintain confidentiality and protect individual identification from deductive disclosure risk, values of less than four are suppressed for reporting purposes and designated with an asterisk. Total calculations shown may not match those derived from detail data presented due to rounding. Data Sources: nVision report for the pay period that includes 09/30/21; downloaded on 11/5/21.
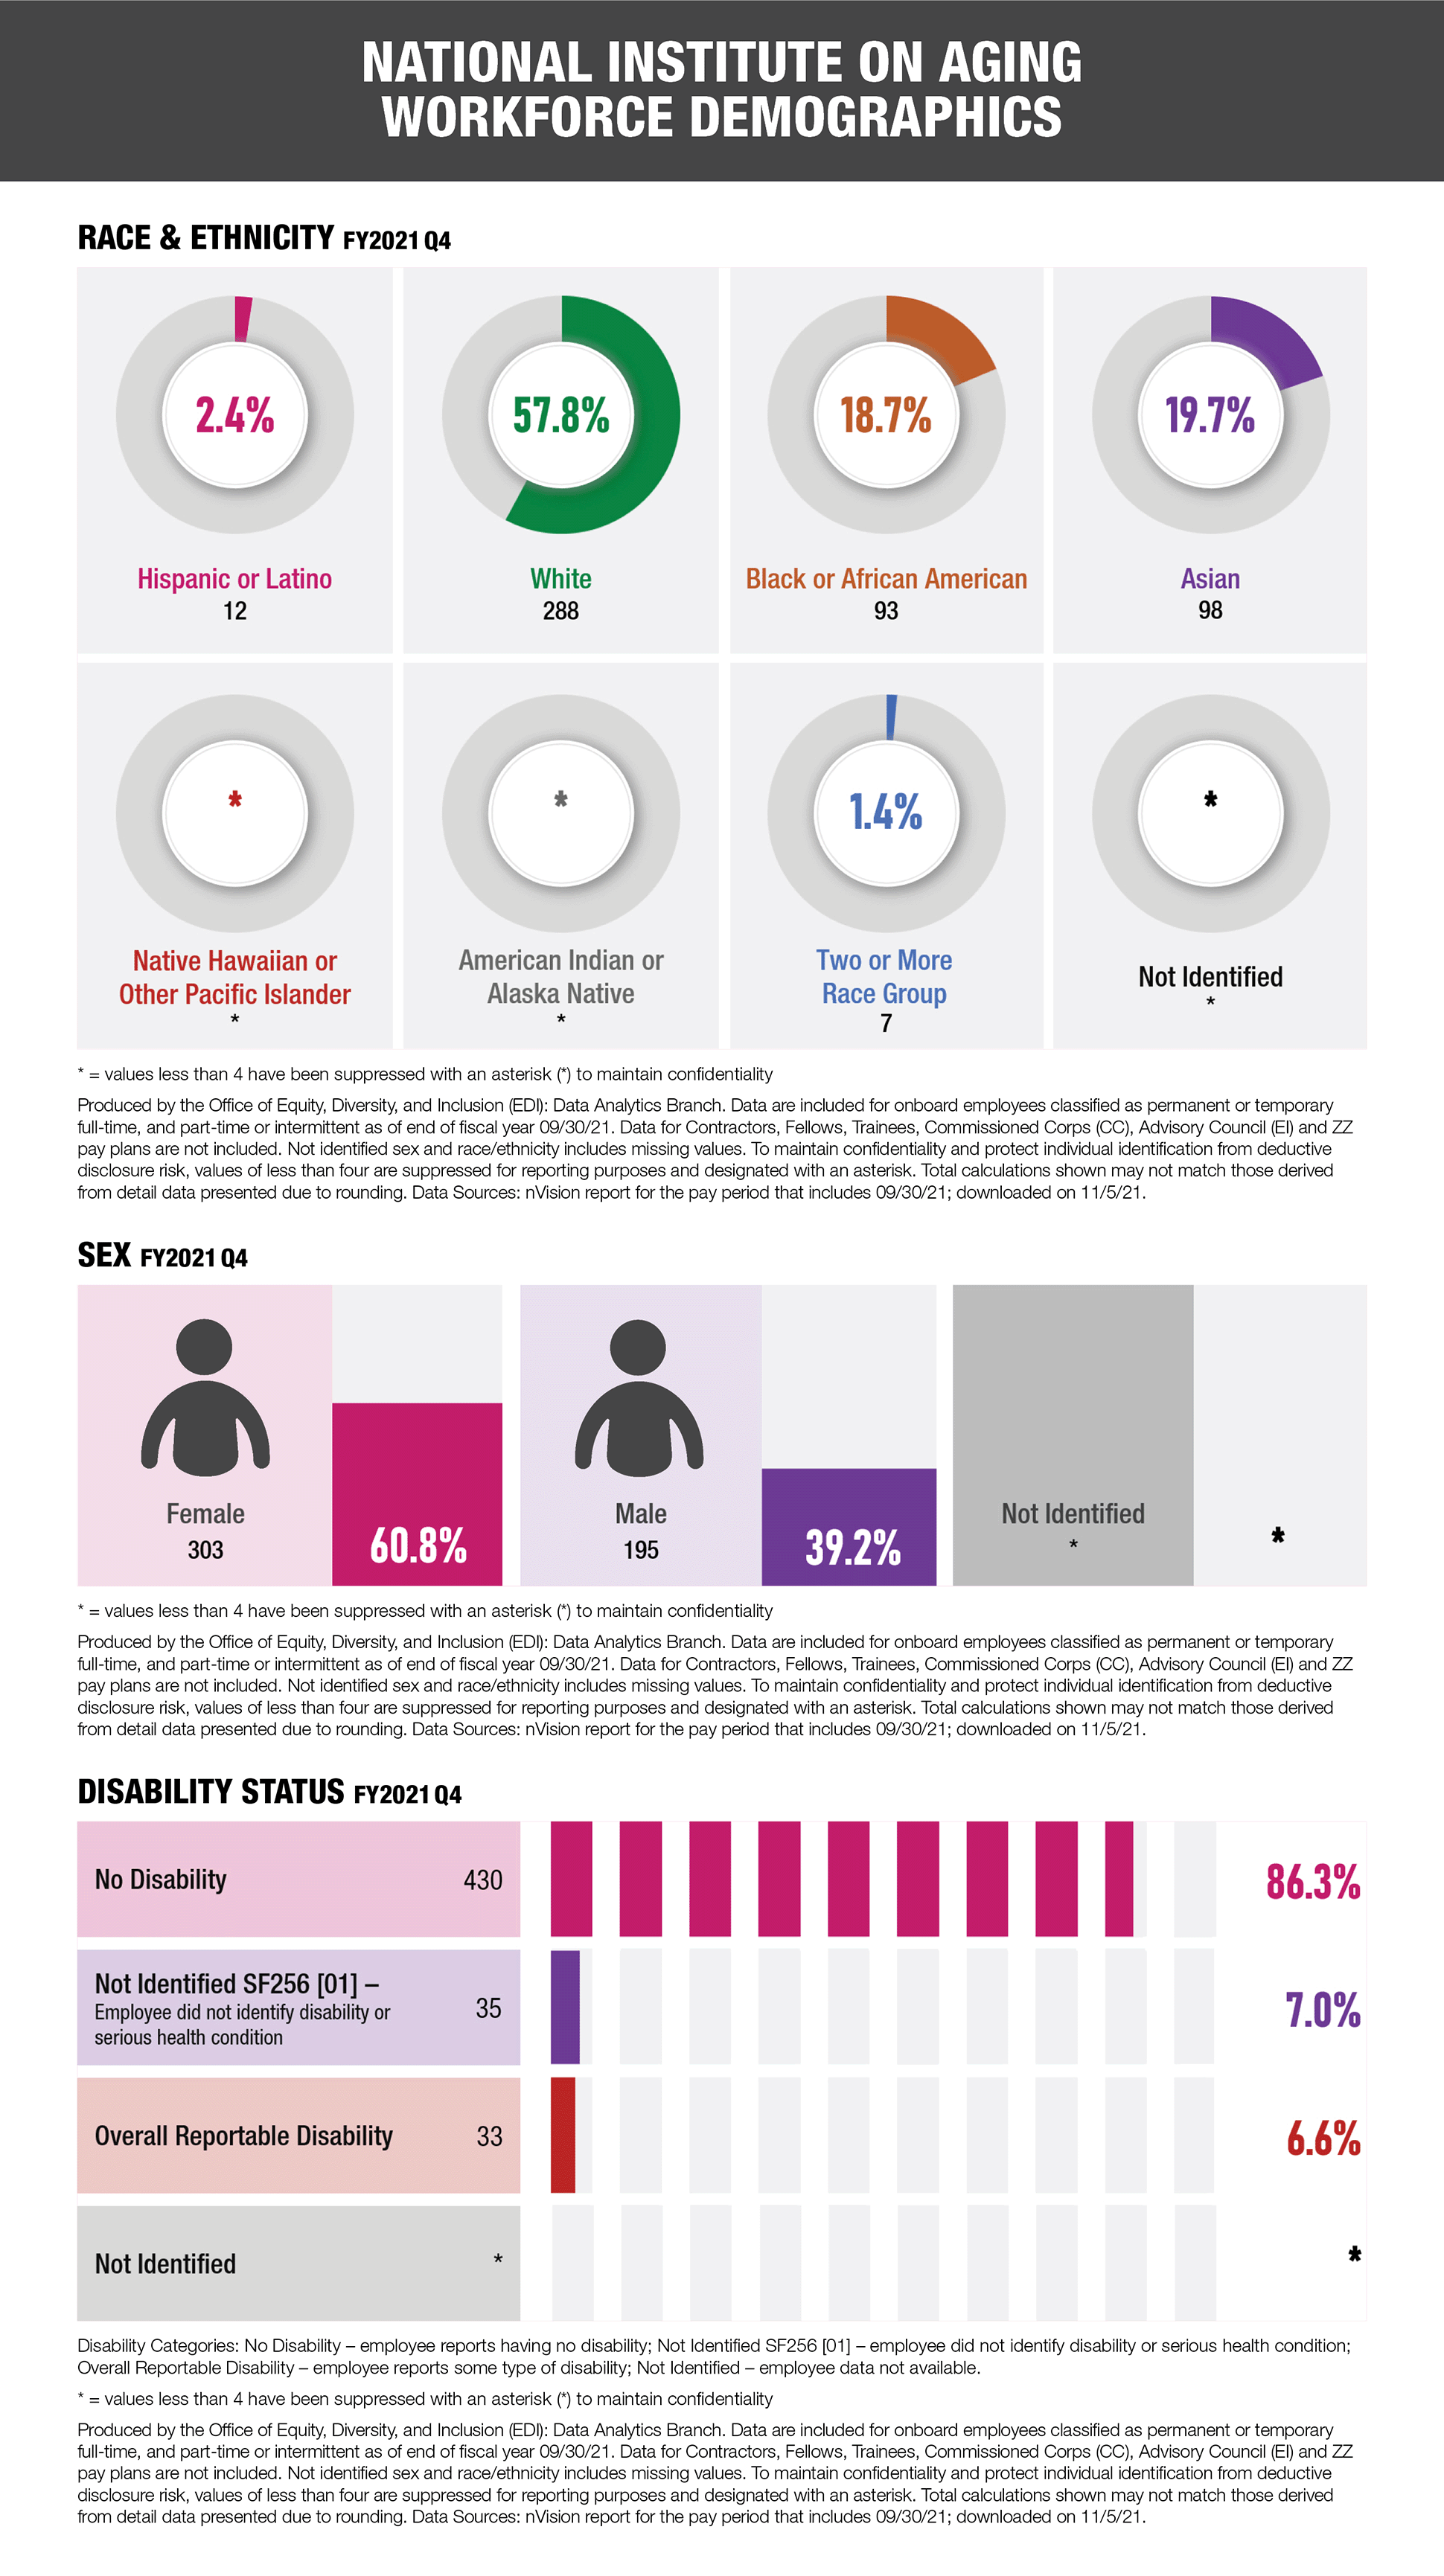
National Institute on Aging Workforce Demographics
Three graphs representing data for the National Institute on Aging Workforce Demographics for FY2021 Q4.
First graph showing race and ethnicity: Hispanic or Latino = 12 and 2.4%; White = 288 and 57.8%; Black or African American = 93 and 18.7%; Asian = 98 and 19.7%; Native Hawaiian or Pacific Islander = * and *%; American Indian or Alaska Native = * and *%; Two or More Race Group = 7 and 1.4%; Not Identified = * and *%
Second graph showing Sex: Female = 303 and 60.8%; Male = 195 and 39.2%; Not Identified = * and *%
Third graph showing disability status: No disability = 430 and 86.3%; Not Identified SF256 [01] – employee did not identify disability or serious health condition= 35 and 7.0%; Overall Reportable Disability = 33 and 6.6%; Not Identified = * and *%
For all graphs: * = values less than 4 have been suppressed with an asterisk (*) to maintain confidentiality
All graphs are produced by the Office of Equity, Diversity, and Inclusion (EDI): Data Analytics Branch. Data are included for onboard employees classified as permanent or temporary full-time, and part-time or intermittent as of end of fiscal year 09/30/21. Data for Contractors, Fellows, Trainees, Commissioned Corps (CC), Advisory Council (EI) and ZZ pay plans are not included. Not identified sex and race/ethnicity includes missing values. To maintain confidentiality and protect individual identification from deductive disclosure risk, values of less than four are suppressed for reporting purposes and designated with an asterisk. Total calculations shown may not match those derived from detail data presented due to rounding. Data Sources: nVision report for the pay period that includes 09/30/21; downloaded on 11/5/21.
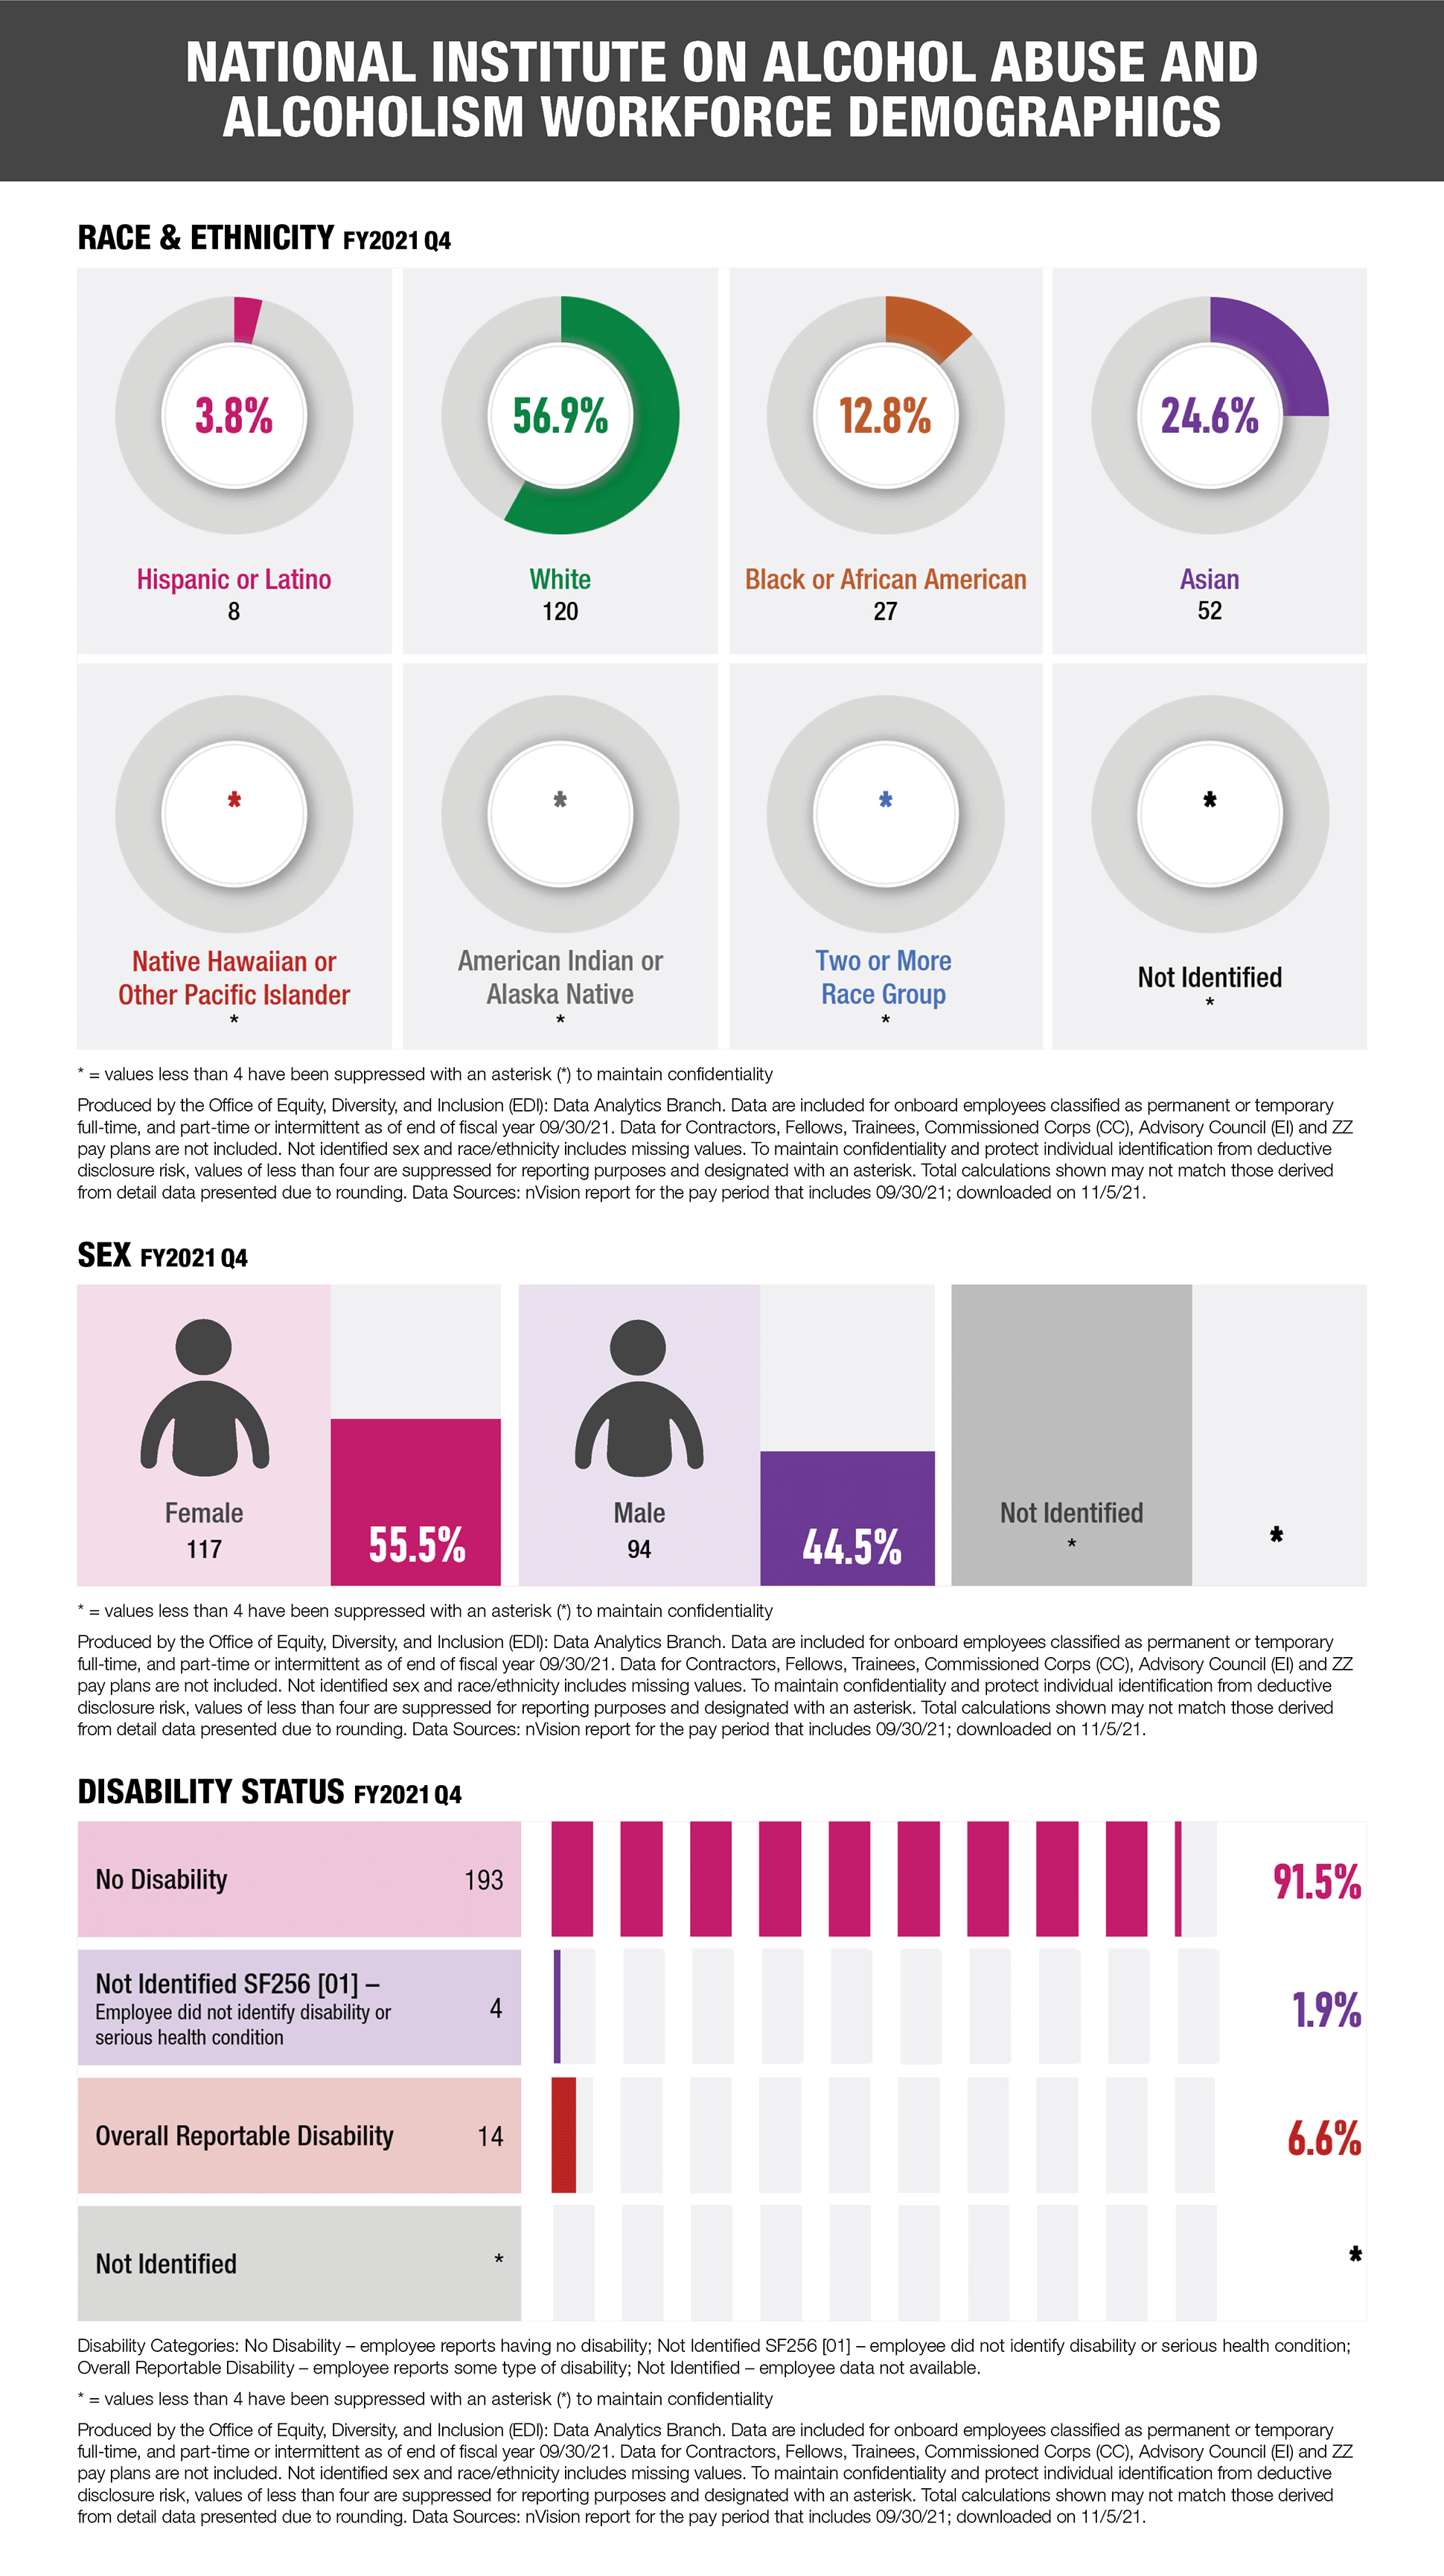
National Institute on Alcohol Abuse and Alcoholism Workforce Demographics
Three graphs representing data for the National Institute on Alcohol Abuse and Alcoholism Workforce Demographics for FY2021 Q4.
First graph showing race and ethnicity: Hispanic or Latino = 8 and 3.8%; White = 120 and 56.9%; Black or African American = 27 and 12.8%; Asian = 52 and 24.6%; Native Hawaiian or Pacific Islander = * and *%; American Indian or Alaska Native = * and *%; Two or More Race Group = * and *%; Not Identified = * and *%
Second graph showing Sex: Female = 117 and 55.5%; Male = 94 and 44.5%; Not Identified = * and *%
Third graph showing disability status: No disability = 193 and 91.5%; Not Identified SF256 [01] – employee did not identify disability or serious health condition= 4 and 1.9%; Overall Reportable Disability = 14 and 6.6%; Not Identified = * and *%
For all graphs: * = values less than 4 have been suppressed with an asterisk (*) to maintain confidentiality
All graphs are produced by the Office of Equity, Diversity, and Inclusion (EDI): Data Analytics Branch. Data are included for onboard employees classified as permanent or temporary full-time, and part-time or intermittent as of end of fiscal year 09/30/21. Data for Contractors, Fellows, Trainees, Commissioned Corps (CC), Advisory Council (EI) and ZZ pay plans are not included. Not identified sex and race/ethnicity includes missing values. To maintain confidentiality and protect individual identification from deductive disclosure risk, values of less than four are suppressed for reporting purposes and designated with an asterisk. Total calculations shown may not match those derived from detail data presented due to rounding. Data Sources: nVision report for the pay period that includes 09/30/21; downloaded on 11/5/21.
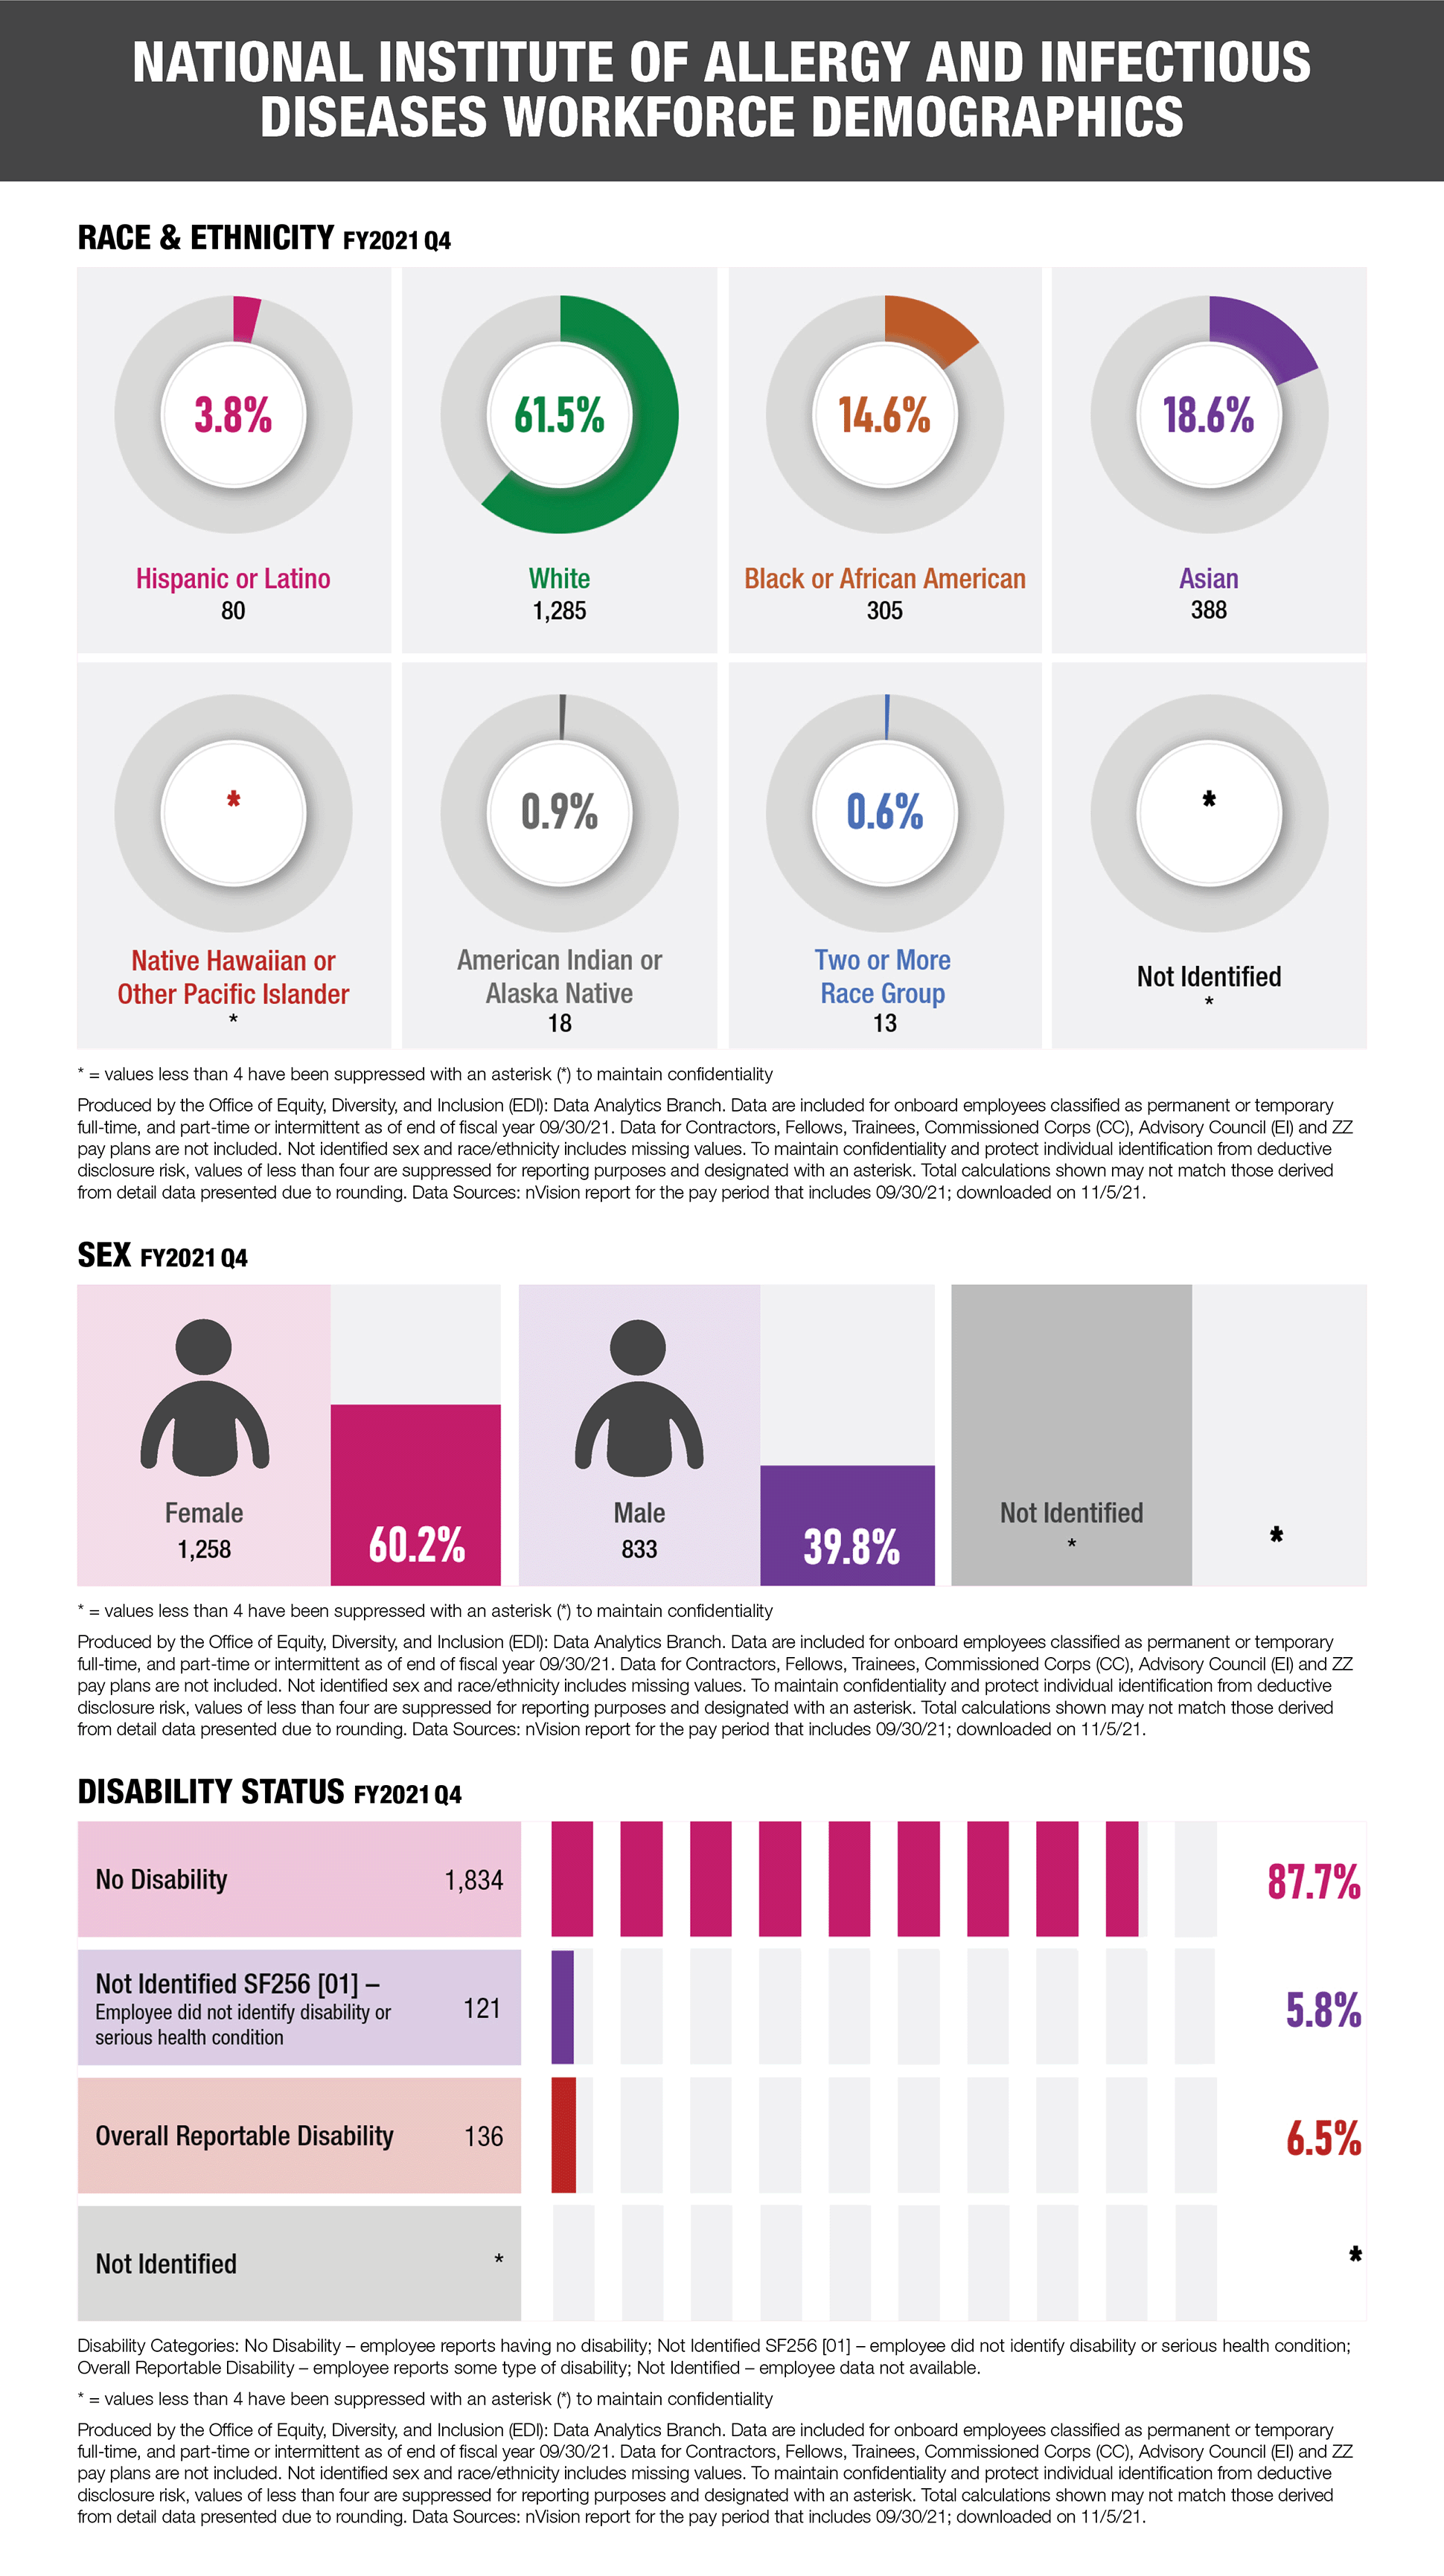
National Institute of Allergy and Infectious Diseases Workforce Demographics
Three graphs representing data for the National Institute of Allergy and Infectious Diseases Workforce Demographics for FY2021 Q4.
First graph showing race and ethnicity: Hispanic or Latino = 80 and 3.8%; White = 1,285 and 61.5%; Black or African American = 305 and 14.6%; Asian = 388 and 18.6%; Native Hawaiian or Pacific Islander = * and *%; American Indian or Alaska Native = 18 and 0.9%; Two or More Race Group = 13 and 0.6%; Not Identified = * and *%
Second graph showing Sex: Female = 1,258 and 60.2%; Male = 833 and 39.8%; Not Identified = * and *%
Third graph showing disability status: No disability = 1,834 and 87.7%; Not Identified SF256 [01] – employee did not identify disability or serious health condition= 121 and 5.8%; Overall Reportable Disability = 136 and 6.5%; Not Identified = * and *%
For all graphs: * = values less than 4 have been suppressed with an asterisk (*) to maintain confidentiality
All graphs are produced by the Office of Equity, Diversity, and Inclusion (EDI): Data Analytics Branch. Data are included for onboard employees classified as permanent or temporary full-time, and part-time or intermittent as of end of fiscal year 09/30/21. Data for Contractors, Fellows, Trainees, Commissioned Corps (CC), Advisory Council (EI) and ZZ pay plans are not included. Not identified sex and race/ethnicity includes missing values. To maintain confidentiality and protect individual identification from deductive disclosure risk, values of less than four are suppressed for reporting purposes and designated with an asterisk. Total calculations shown may not match those derived from detail data presented due to rounding. Data Sources: nVision report for the pay period that includes 09/30/21; downloaded on 11/5/21.
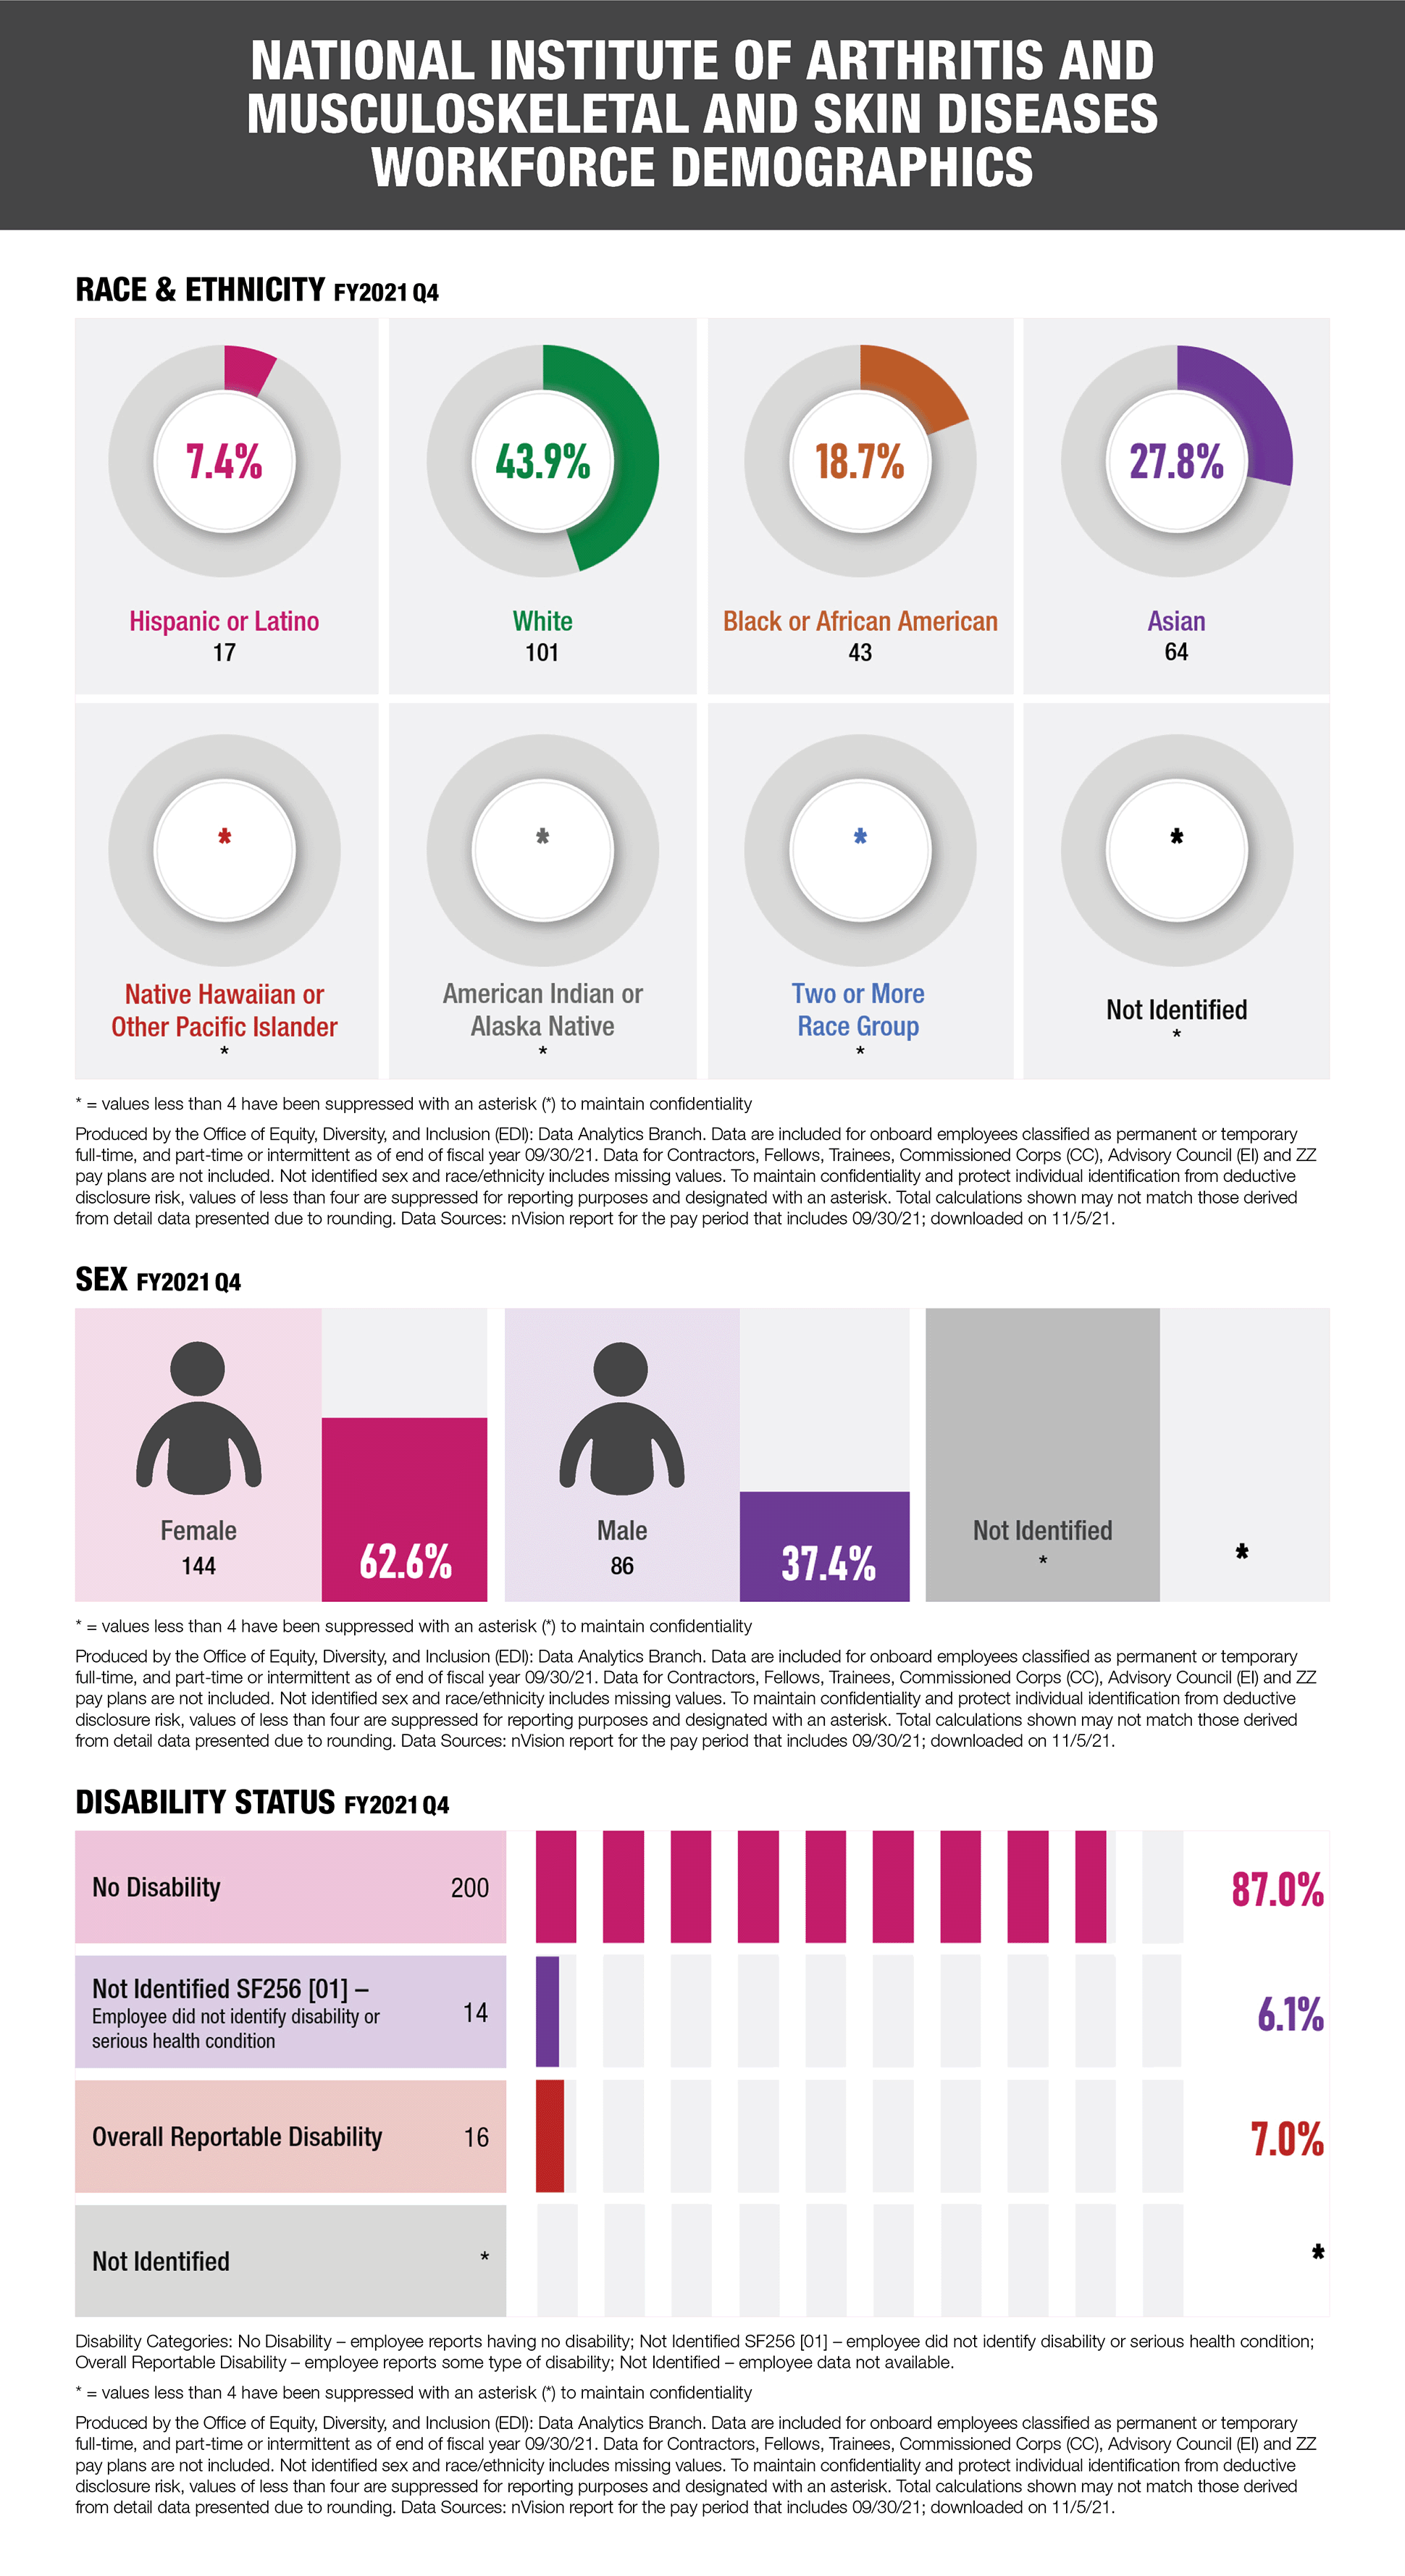
National Institute of Arthritis and Musculoskeletal and Skin Disease Workforce Demographics
Three graphs representing data for the National Institute of Arthritis and Musculoskeletal and Skin Disease Workforce Demographics for FY2021 Q4.
First graph showing race and ethnicity: Hispanic or Latino = 17 and 7.4%; White = 101 and 43.9%; Black or African American = 43 and 18.7%; Asian = 64 and 27.8%; Native Hawaiian or Pacific Islander = * and *%; American Indian or Alaska Native = * and *%; Two or More Race Group = * and *%; Not Identified = * and *%
Second graph showing Sex: Female = 144 and 62.6%; Male = 86 and 37.4%; Not Identified = * and *%
Third graph showing disability status: No disability = 200 and 87.0%; Not Identified SF256 [01] – employee did not identify disability or serious health condition= 14 and 6.1%; Overall Reportable Disability = 16 and 7.0%; Not Identified = * and *%
For all graphs: * = values less than 4 have been suppressed with an asterisk (*) to maintain confidentiality
All graphs are produced by the Office of Equity, Diversity, and Inclusion (EDI): Data Analytics Branch. Data are included for onboard employees classified as permanent or temporary full-time, and part-time or intermittent as of end of fiscal year 09/30/21. Data for Contractors, Fellows, Trainees, Commissioned Corps (CC), Advisory Council (EI) and ZZ pay plans are not included. Not identified sex and race/ethnicity includes missing values. To maintain confidentiality and protect individual identification from deductive disclosure risk, values of less than four are suppressed for reporting purposes and designated with an asterisk. Total calculations shown may not match those derived from detail data presented due to rounding. Data Sources: nVision report for the pay period that includes 09/30/21; downloaded on 11/5/21.
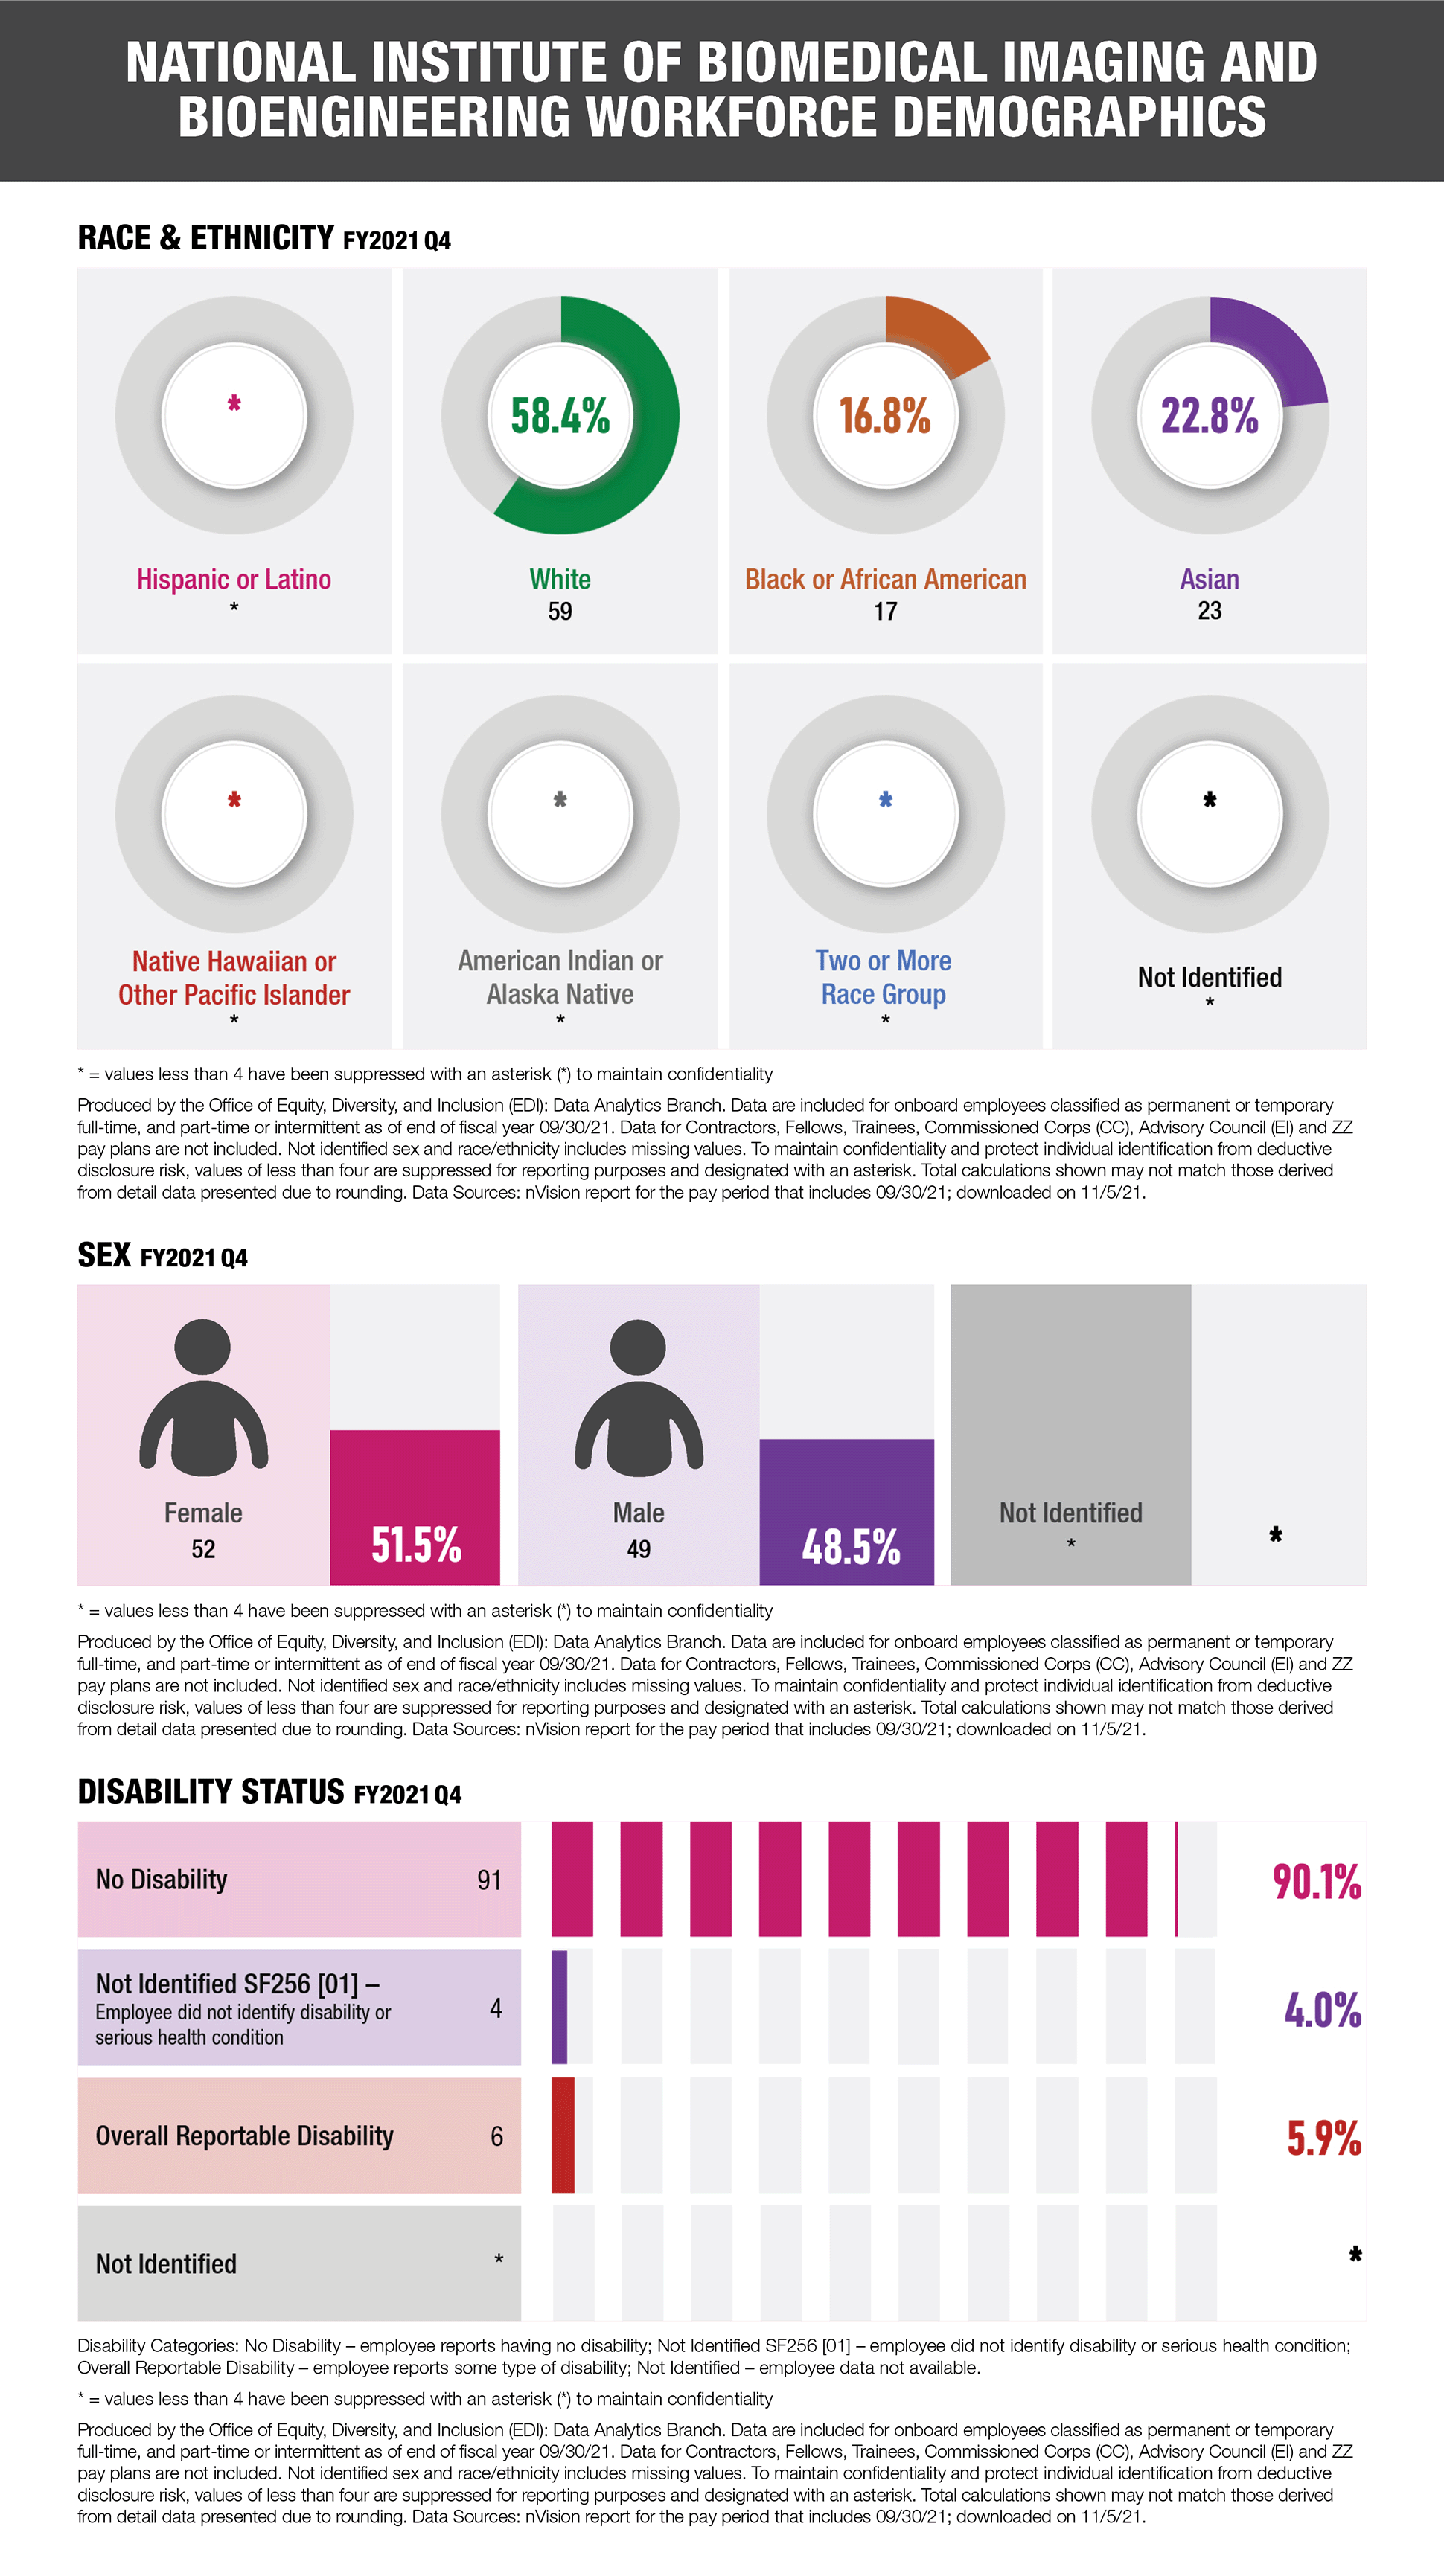
National Institute of Biomedical Imaging and Bioengineering Workforce Demographics
Three graphs representing data for the National Institute of Biomedical Imaging and Bioengineering Workforce Demographics for FY2021 Q4.
First graph showing race and ethnicity: Hispanic or Latino = * and *%; White = 59 and 58.4%; Black or African American = 17 and 16.8%; Asian = 23 and 22.8%; Native Hawaiian or Pacific Islander = * and *%; American Indian or Alaska Native = * and *%; Two or More Race Group = * and *%; Not Identified = * and *%
Second graph showing Sex: Female = 52 and 51.5%; Male = 49 and 48.5%; Not Identified = * and *%
Third graph showing disability status: No disability = 91 and 90.1%; Not Identified SF256 [01] – employee did not identify disability or serious health condition= 4 and 4.0%; Overall Reportable Disability = 6 and 5.9%; Not Identified = * and *%
For all graphs: * = values less than 4 have been suppressed with an asterisk (*) to maintain confidentiality
All graphs are produced by the Office of Equity, Diversity, and Inclusion (EDI): Data Analytics Branch. Data are included for onboard employees classified as permanent or temporary full-time, and part-time or intermittent as of end of fiscal year 09/30/21. Data for Contractors, Fellows, Trainees, Commissioned Corps (CC), Advisory Council (EI) and ZZ pay plans are not included. Not identified sex and race/ethnicity includes missing values. To maintain confidentiality and protect individual identification from deductive disclosure risk, values of less than four are suppressed for reporting purposes and designated with an asterisk. Total calculations shown may not match those derived from detail data presented due to rounding. Data Sources: nVision report for the pay period that includes 09/30/21; downloaded on 11/5/21.
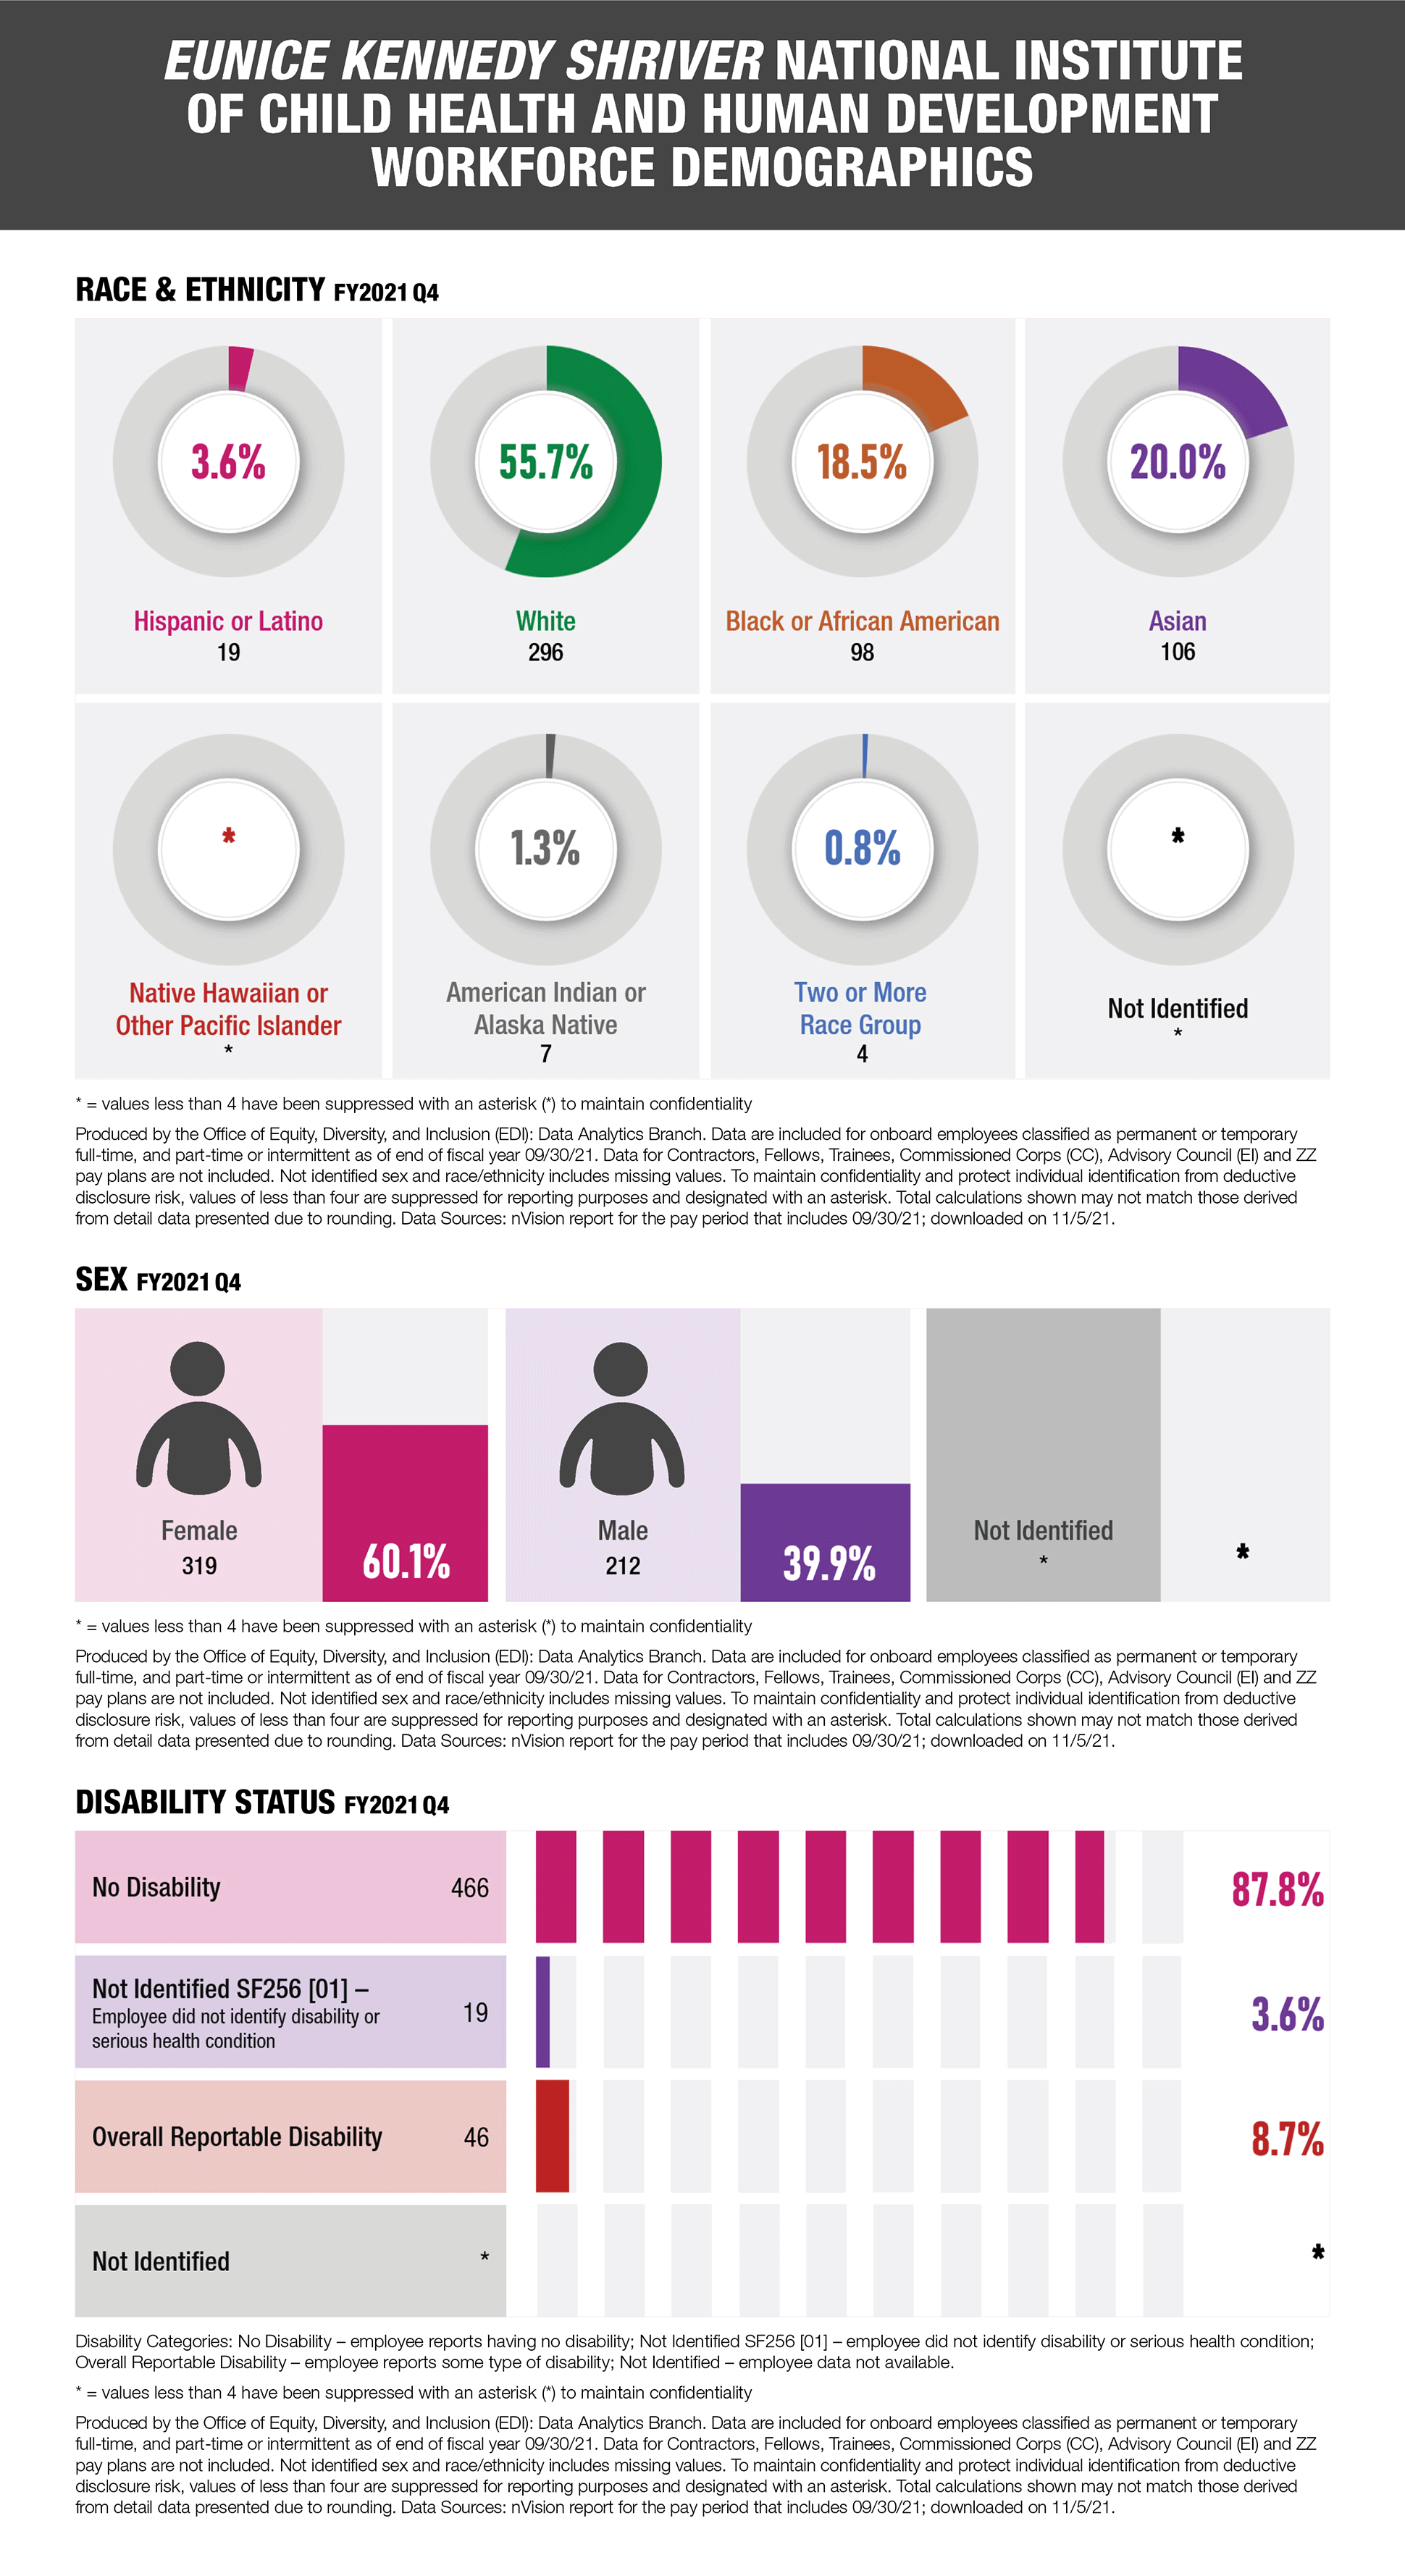
Eunice Kennedy Shriver National Institute of Child Health and Human Development Workforce Demographics
Three graphs representing data for the Eunice Kennedy Shriver National Institute of Child Health and Human Development Workforce Demographics for FY2021 Q4.
First graph showing race and ethnicity: Hispanic or Latino = 19 and 3.6%; White = 296 and 55.7%; Black or African American = 98 and 18.5%; Asian = 106 and 20.0%; Native Hawaiian or Pacific Islander = * and *%; American Indian or Alaska Native = 7 and 1.3%; Two or More Race Group = 4 and 0.8%; Not Identified = * and *%
Second graph showing Sex: Female = 319 and 60.1%; Male = 212 and 39.9%; Not Identified = * and *%
Third graph showing disability status: No disability = 466 and 87.8%; Not Identified SF256 [01] – employee did not identify disability or serious health condition= 19 and 3.6%; Overall Reportable Disability = 46 and 8.7%; Not Identified = * and *%
For all graphs: * = values less than 4 have been suppressed with an asterisk (*) to maintain confidentiality
All graphs are produced by the Office of Equity, Diversity, and Inclusion (EDI): Data Analytics Branch. Data are included for onboard employees classified as permanent or temporary full-time, and part-time or intermittent as of end of fiscal year 09/30/21. Data for Contractors, Fellows, Trainees, Commissioned Corps (CC), Advisory Council (EI) and ZZ pay plans are not included. Not identified sex and race/ethnicity includes missing values. To maintain confidentiality and protect individual identification from deductive disclosure risk, values of less than four are suppressed for reporting purposes and designated with an asterisk. Total calculations shown may not match those derived from detail data presented due to rounding. Data Sources: nVision report for the pay period that includes 09/30/21; downloaded on 11/5/21.
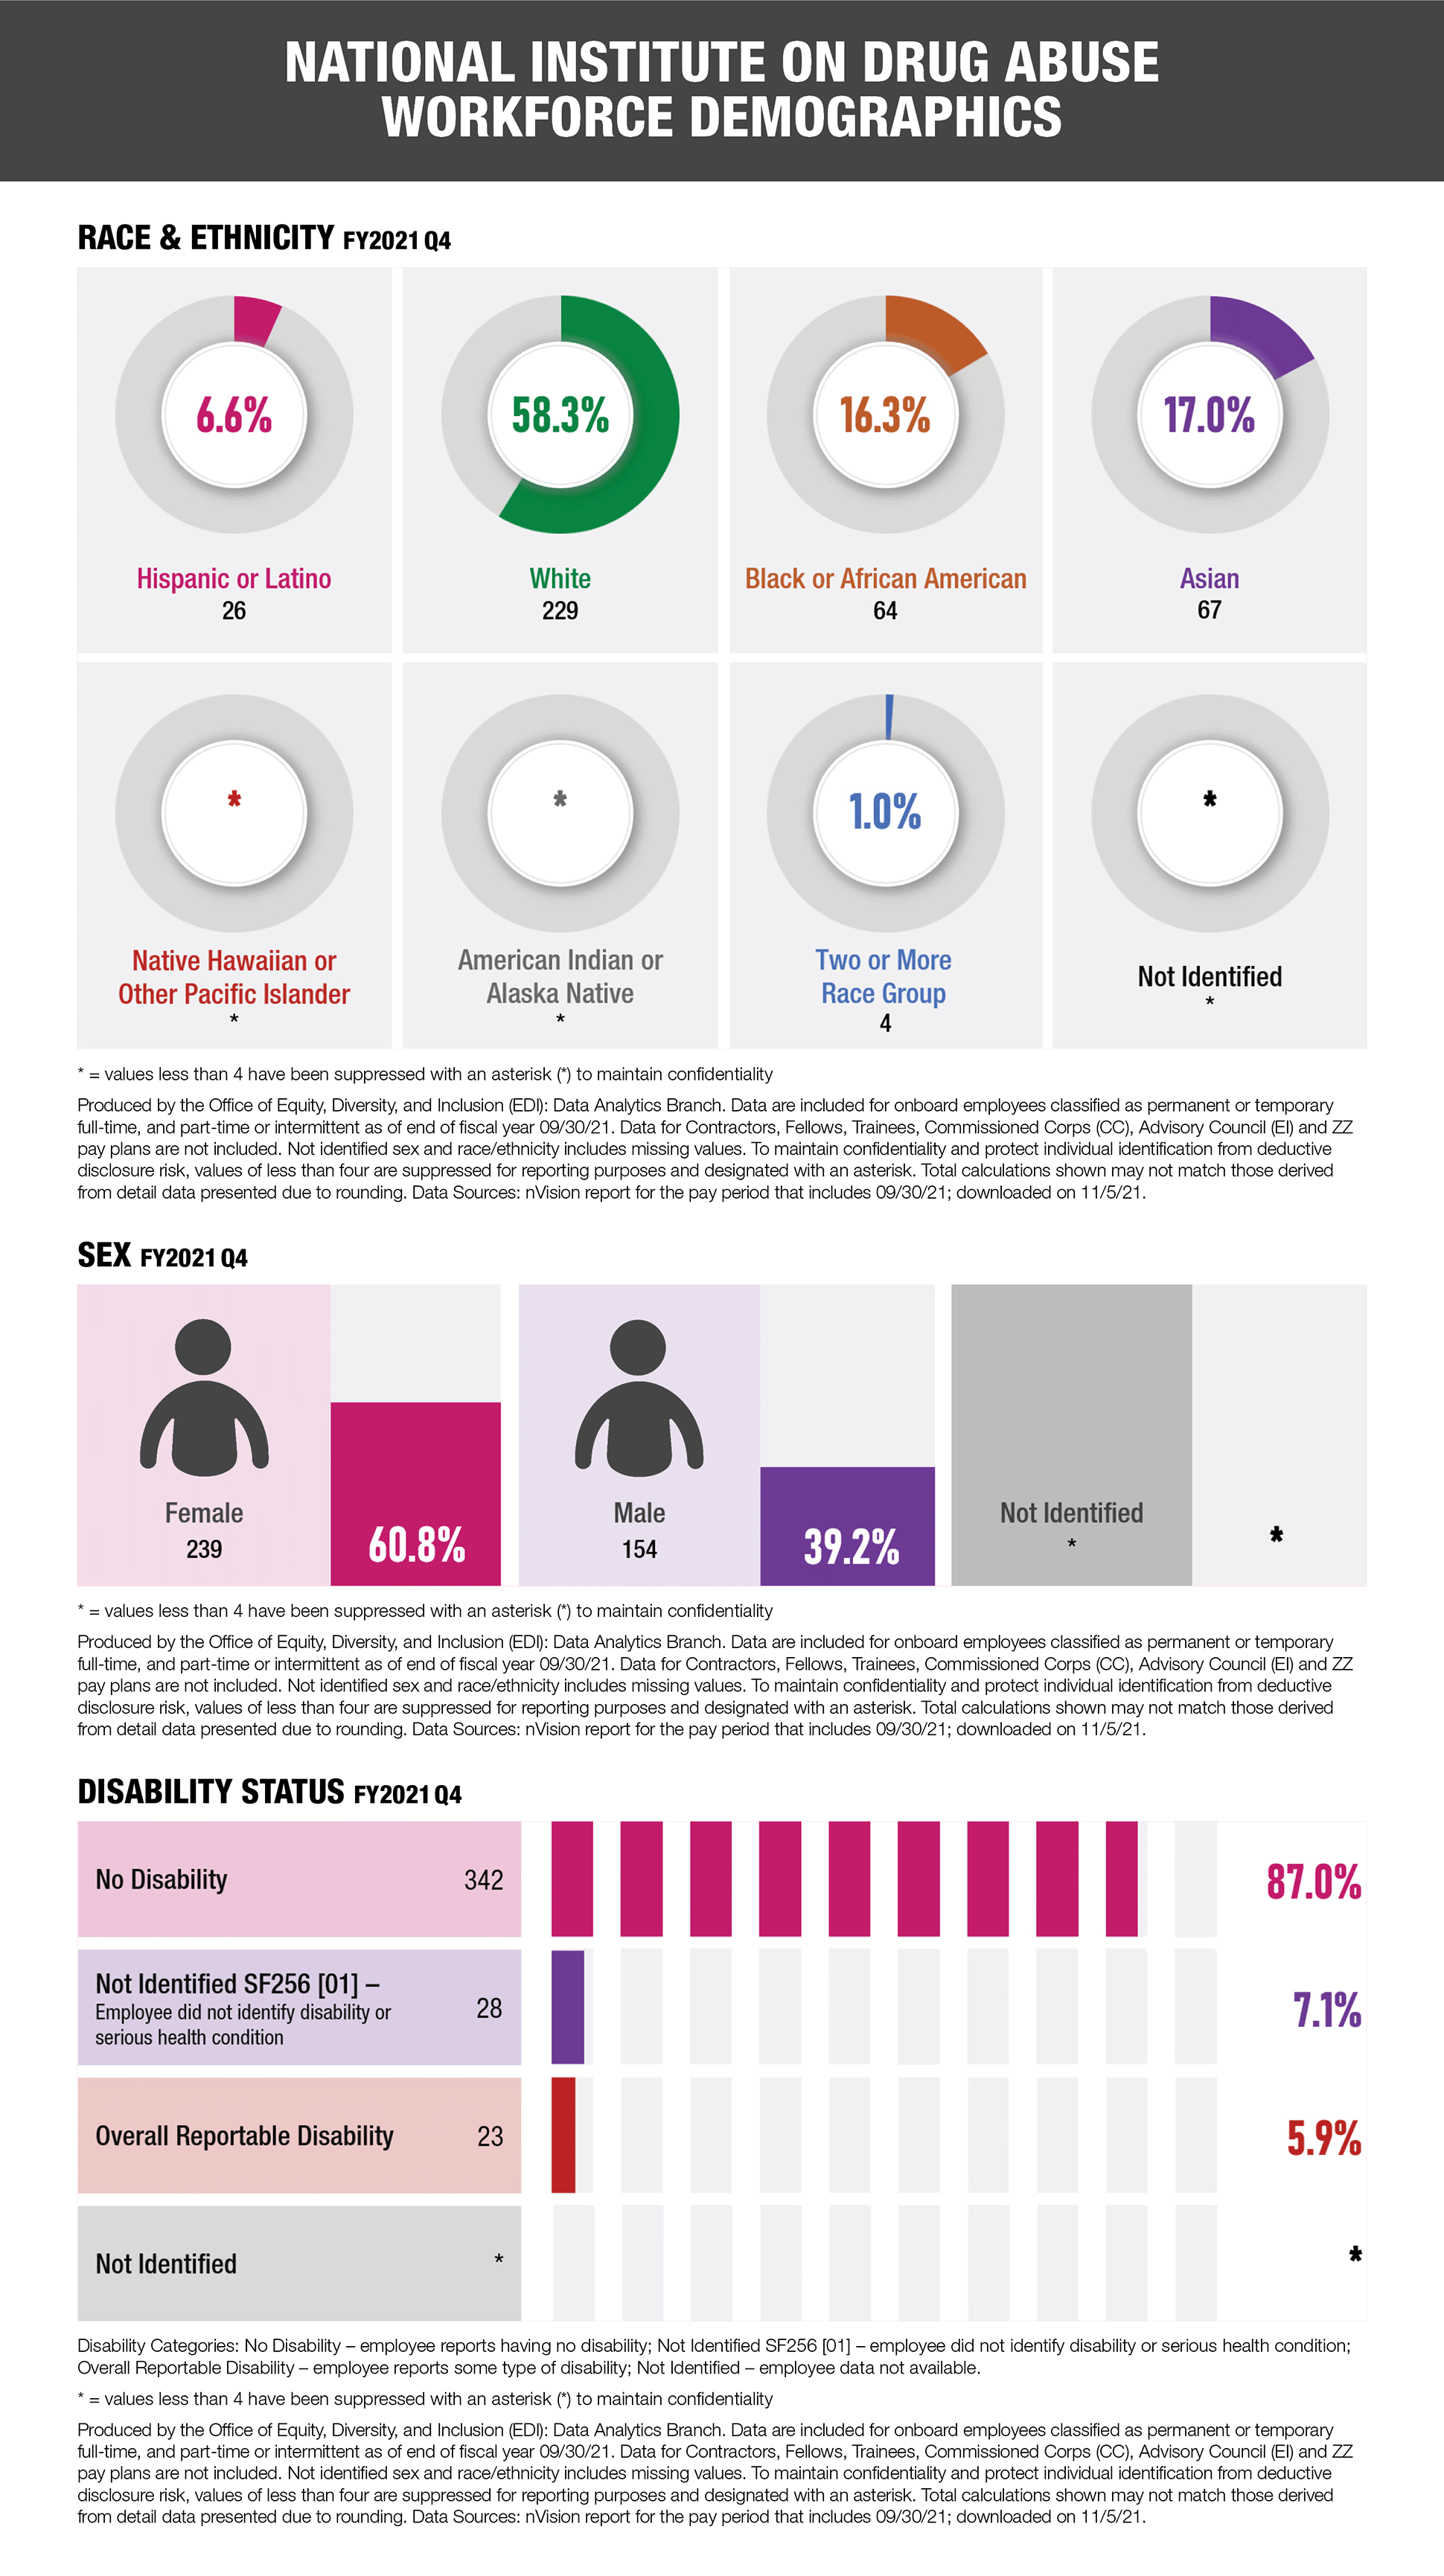
National Institute on Drug Abuse Workforce Demographics
Three graphs representing data for the National Institute on Drug Abuse Workforce Demographics for FY2021 Q4.
First graph showing race and ethnicity: Hispanic or Latino = 26 and 6.6%; White = 229 and 58.3%; Black or African American = 64 and 16.3%; Asian = 67 and 17.0%; Native Hawaiian or Pacific Islander = * and *%; American Indian or Alaska Native = * and *%; Two or More Race Group = 4 and 1.0%; Not Identified = * and *%
Second graph showing Sex: Female = 239 and 60.8%; Male = 154 and 39.2%; Not Identified = * and *%
Third graph showing disability status: No disability = 342 and 87.0%; Not Identified SF256 [01] – employee did not identify disability or serious health condition= 28 and 7.1%; Overall Reportable Disability = 23 and 5.9%; Not Identified = * and *%
For all graphs: * = values less than 4 have been suppressed with an asterisk (*) to maintain confidentiality
All graphs are produced by the Office of Equity, Diversity, and Inclusion (EDI): Data Analytics Branch. Data are included for onboard employees classified as permanent or temporary full-time, and part-time or intermittent as of end of fiscal year 09/30/21. Data for Contractors, Fellows, Trainees, Commissioned Corps (CC), Advisory Council (EI) and ZZ pay plans are not included. Not identified sex and race/ethnicity includes missing values. To maintain confidentiality and protect individual identification from deductive disclosure risk, values of less than four are suppressed for reporting purposes and designated with an asterisk. Total calculations shown may not match those derived from detail data presented due to rounding. Data Sources: nVision report for the pay period that includes 09/30/21; downloaded on 11/5/21.
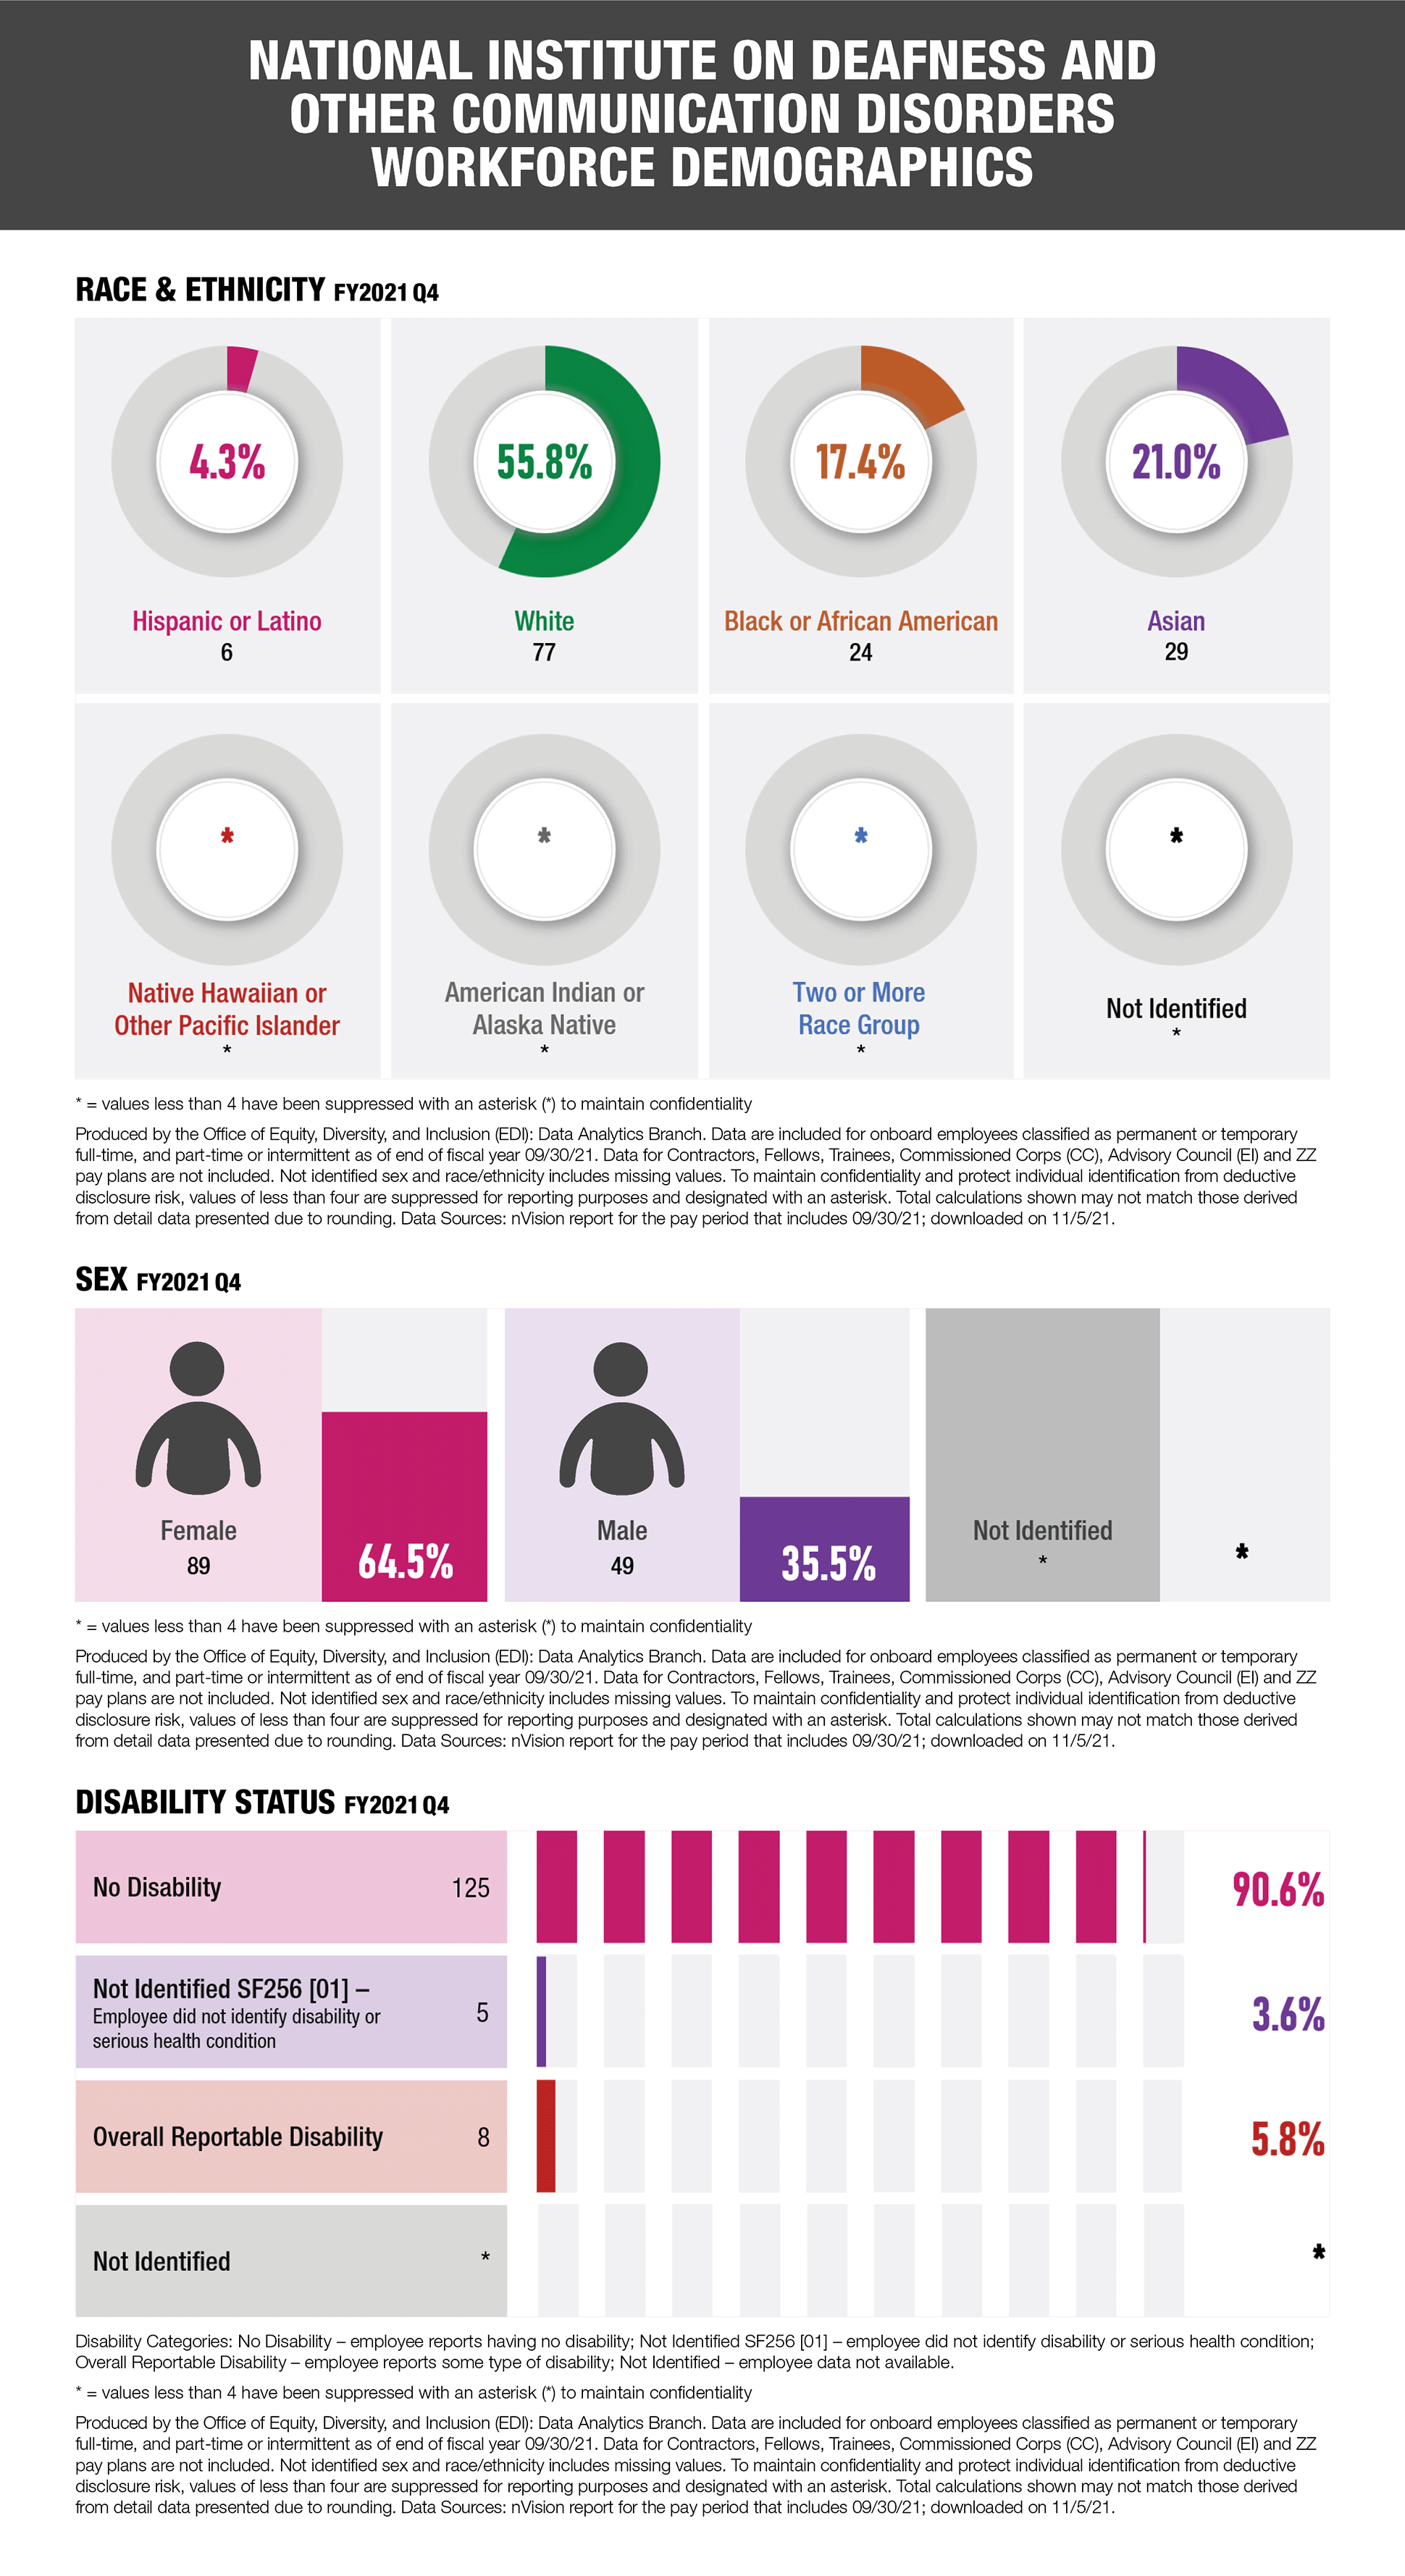
National Institute on Deafness and Other Communication Disorders Workforce Demographics
Three graphs representing data for the National Institute on Deafness and Other Communication Disorders Workforce Demographics for FY2021 Q4.
First graph showing race and ethnicity: Hispanic or Latino = 6 and 4.3%; White = 77 and 55.8%; Black or African American = 27 and 17.4%; Asian = 29 and 21.0%; Native Hawaiian or Pacific Islander = * and *%; American Indian or Alaska Native = * and *%; Two or More Race Group = * and *%; Not Identified = * and *%
Second graph showing Sex: Female = 89 and 64.5%; Male = 49 and 35.5%; Not Identified = * and *%
Third graph showing disability status: No disability = 125 and 90.6%; Not Identified SF256 [01] – employee did not identify disability or serious health condition= 5 and 3.6%; Overall Reportable Disability = 8 and 5.8%; Not Identified = * and *%
For all graphs: * = values less than 4 have been suppressed with an asterisk (*) to maintain confidentiality
All graphs are produced by the Office of Equity, Diversity, and Inclusion (EDI): Data Analytics Branch. Data are included for onboard employees classified as permanent or temporary full-time, and part-time or intermittent as of end of fiscal year 09/30/21. Data for Contractors, Fellows, Trainees, Commissioned Corps (CC), Advisory Council (EI) and ZZ pay plans are not included. Not identified sex and race/ethnicity includes missing values. To maintain confidentiality and protect individual identification from deductive disclosure risk, values of less than four are suppressed for reporting purposes and designated with an asterisk. Total calculations shown may not match those derived from detail data presented due to rounding. Data Sources: nVision report for the pay period that includes 09/30/21; downloaded on 11/5/21.
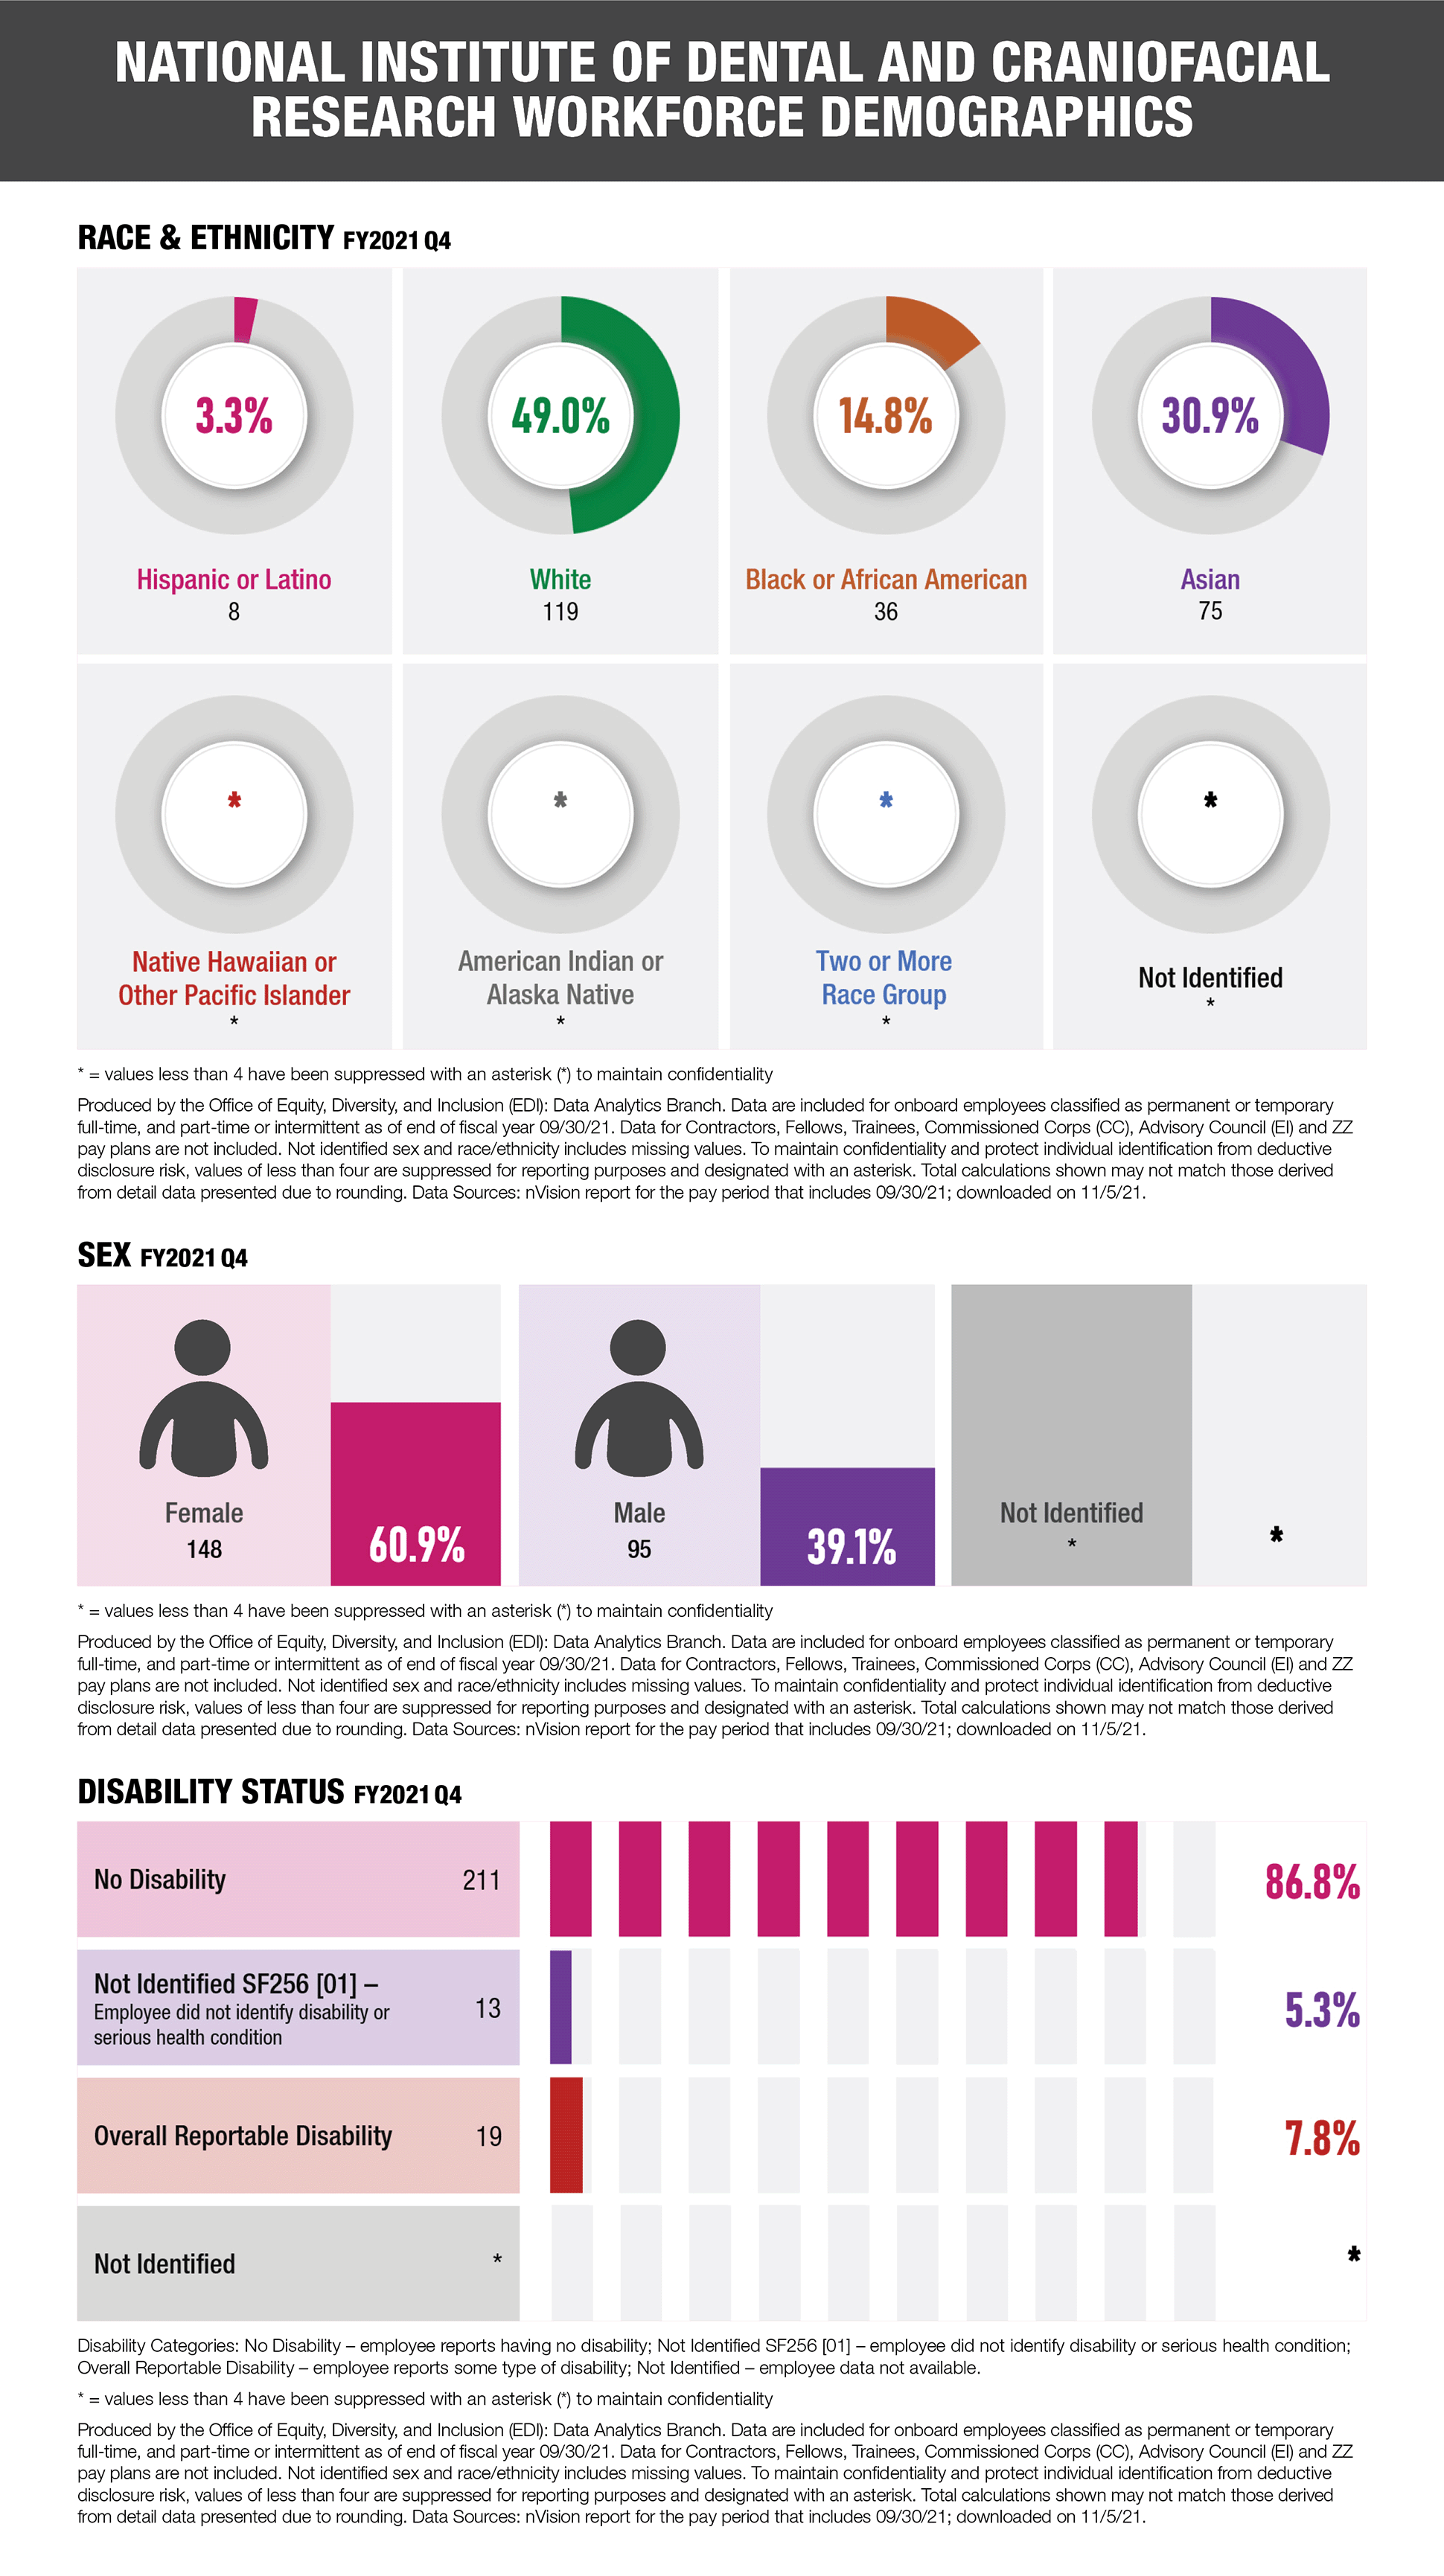
National Institute of Dental and Craniofacial Research Workforce Demographics
Three graphs representing data for the National Institute of Dental and Craniofacial Research Workforce Demographics for FY2021 Q4.
First graph showing race and ethnicity: Hispanic or Latino = 8 and 3.3%; White = 119 and 49.0%; Black or African American = 36 and 14.8%; Asian = 75 and 30.9%; Native Hawaiian or Pacific Islander = * and *%; American Indian or Alaska Native = * and *%; Two or More Race Group = * and *%; Not Identified = * and *%
Second graph showing Sex: Female = 148 and 60.9%; Male = 95 and 39.1%; Not Identified = * and *%
Third graph showing disability status: No disability = 211 and 86.8%; Not Identified SF256 [01] – employee did not identify disability or serious health condition= 13 and 5.3%; Overall Reportable Disability = 19 and 7.8%; Not Identified = * and *%
For all graphs: * = values less than 4 have been suppressed with an asterisk (*) to maintain confidentiality
All graphs are produced by the Office of Equity, Diversity, and Inclusion (EDI): Data Analytics Branch. Data are included for onboard employees classified as permanent or temporary full-time, and part-time or intermittent as of end of fiscal year 09/30/21. Data for Contractors, Fellows, Trainees, Commissioned Corps (CC), Advisory Council (EI) and ZZ pay plans are not included. Not identified sex and race/ethnicity includes missing values. To maintain confidentiality and protect individual identification from deductive disclosure risk, values of less than four are suppressed for reporting purposes and designated with an asterisk. Total calculations shown may not match those derived from detail data presented due to rounding. Data Sources: nVision report for the pay period that includes 09/30/21; downloaded on 11/5/21.
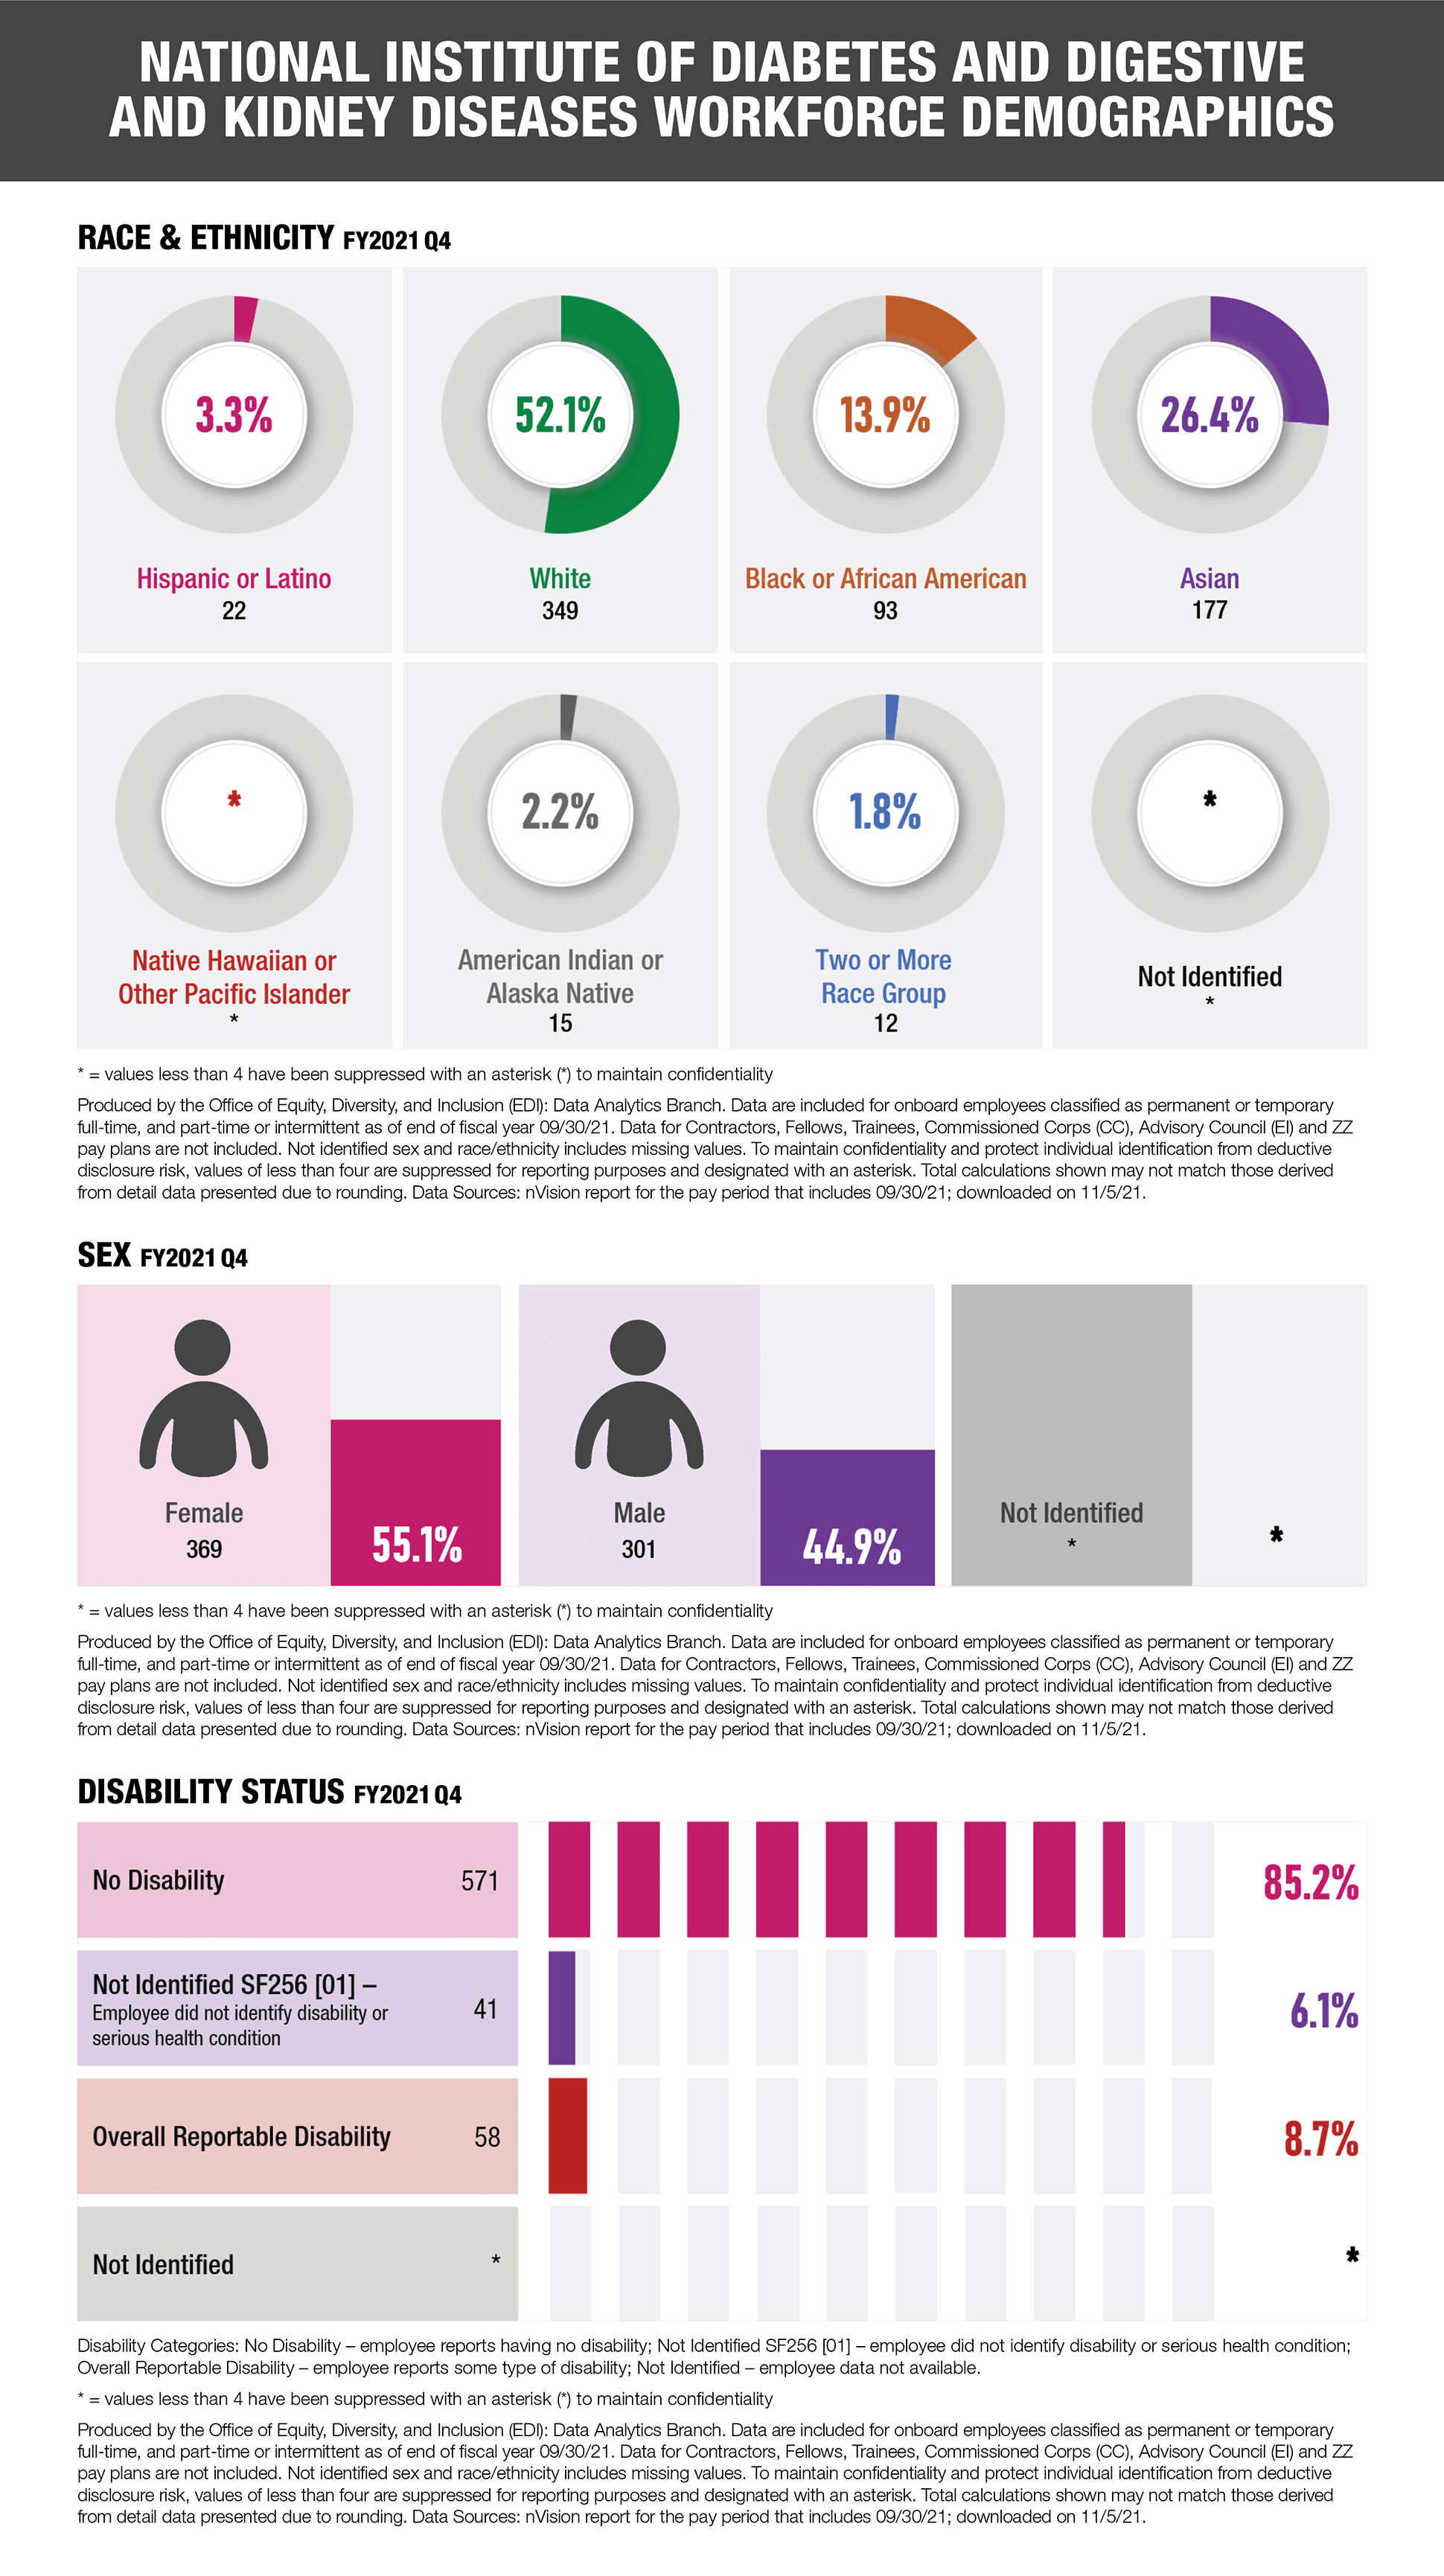
National Institute of Diabetes and Digestive and Kidney Diseases Workforce Demographics
Three graphs representing data for the National Institute of Diabetes and Digestive and Kidney Diseases Workforce Demographics for FY2021 Q4.
First graph showing race and ethnicity: Hispanic or Latino = 22 and 3.3%; White = 349 and 52.1%; Black or African American = 93 and 13.9%; Asian = 177 and 26.4%; Native Hawaiian or Pacific Islander = * and *%; American Indian or Alaska Native = 15 and 2.2%; Two or More Race Group = 12 and 1.8%; Not Identified = * and *%
Second graph showing Sex: Female = 369 and 55.1%; Male = 301 and 44.9%; Not Identified = * and *%
Third graph showing disability status: No disability = 571 and 85.2%; Not Identified SF256 [01] – employee did not identify disability or serious health condition= 41 and 6.1%; Overall Reportable Disability = 58 and 8.7%; Not Identified = * and *%
For all graphs: * = values less than 4 have been suppressed with an asterisk (*) to maintain confidentiality
All graphs are produced by the Office of Equity, Diversity, and Inclusion (EDI): Data Analytics Branch. Data are included for onboard employees classified as permanent or temporary full-time, and part-time or intermittent as of end of fiscal year 09/30/21. Data for Contractors, Fellows, Trainees, Commissioned Corps (CC), Advisory Council (EI) and ZZ pay plans are not included. Not identified sex and race/ethnicity includes missing values. To maintain confidentiality and protect individual identification from deductive disclosure risk, values of less than four are suppressed for reporting purposes and designated with an asterisk. Total calculations shown may not match those derived from detail data presented due to rounding. Data Sources: nVision report for the pay period that includes 09/30/21; downloaded on 11/5/21.
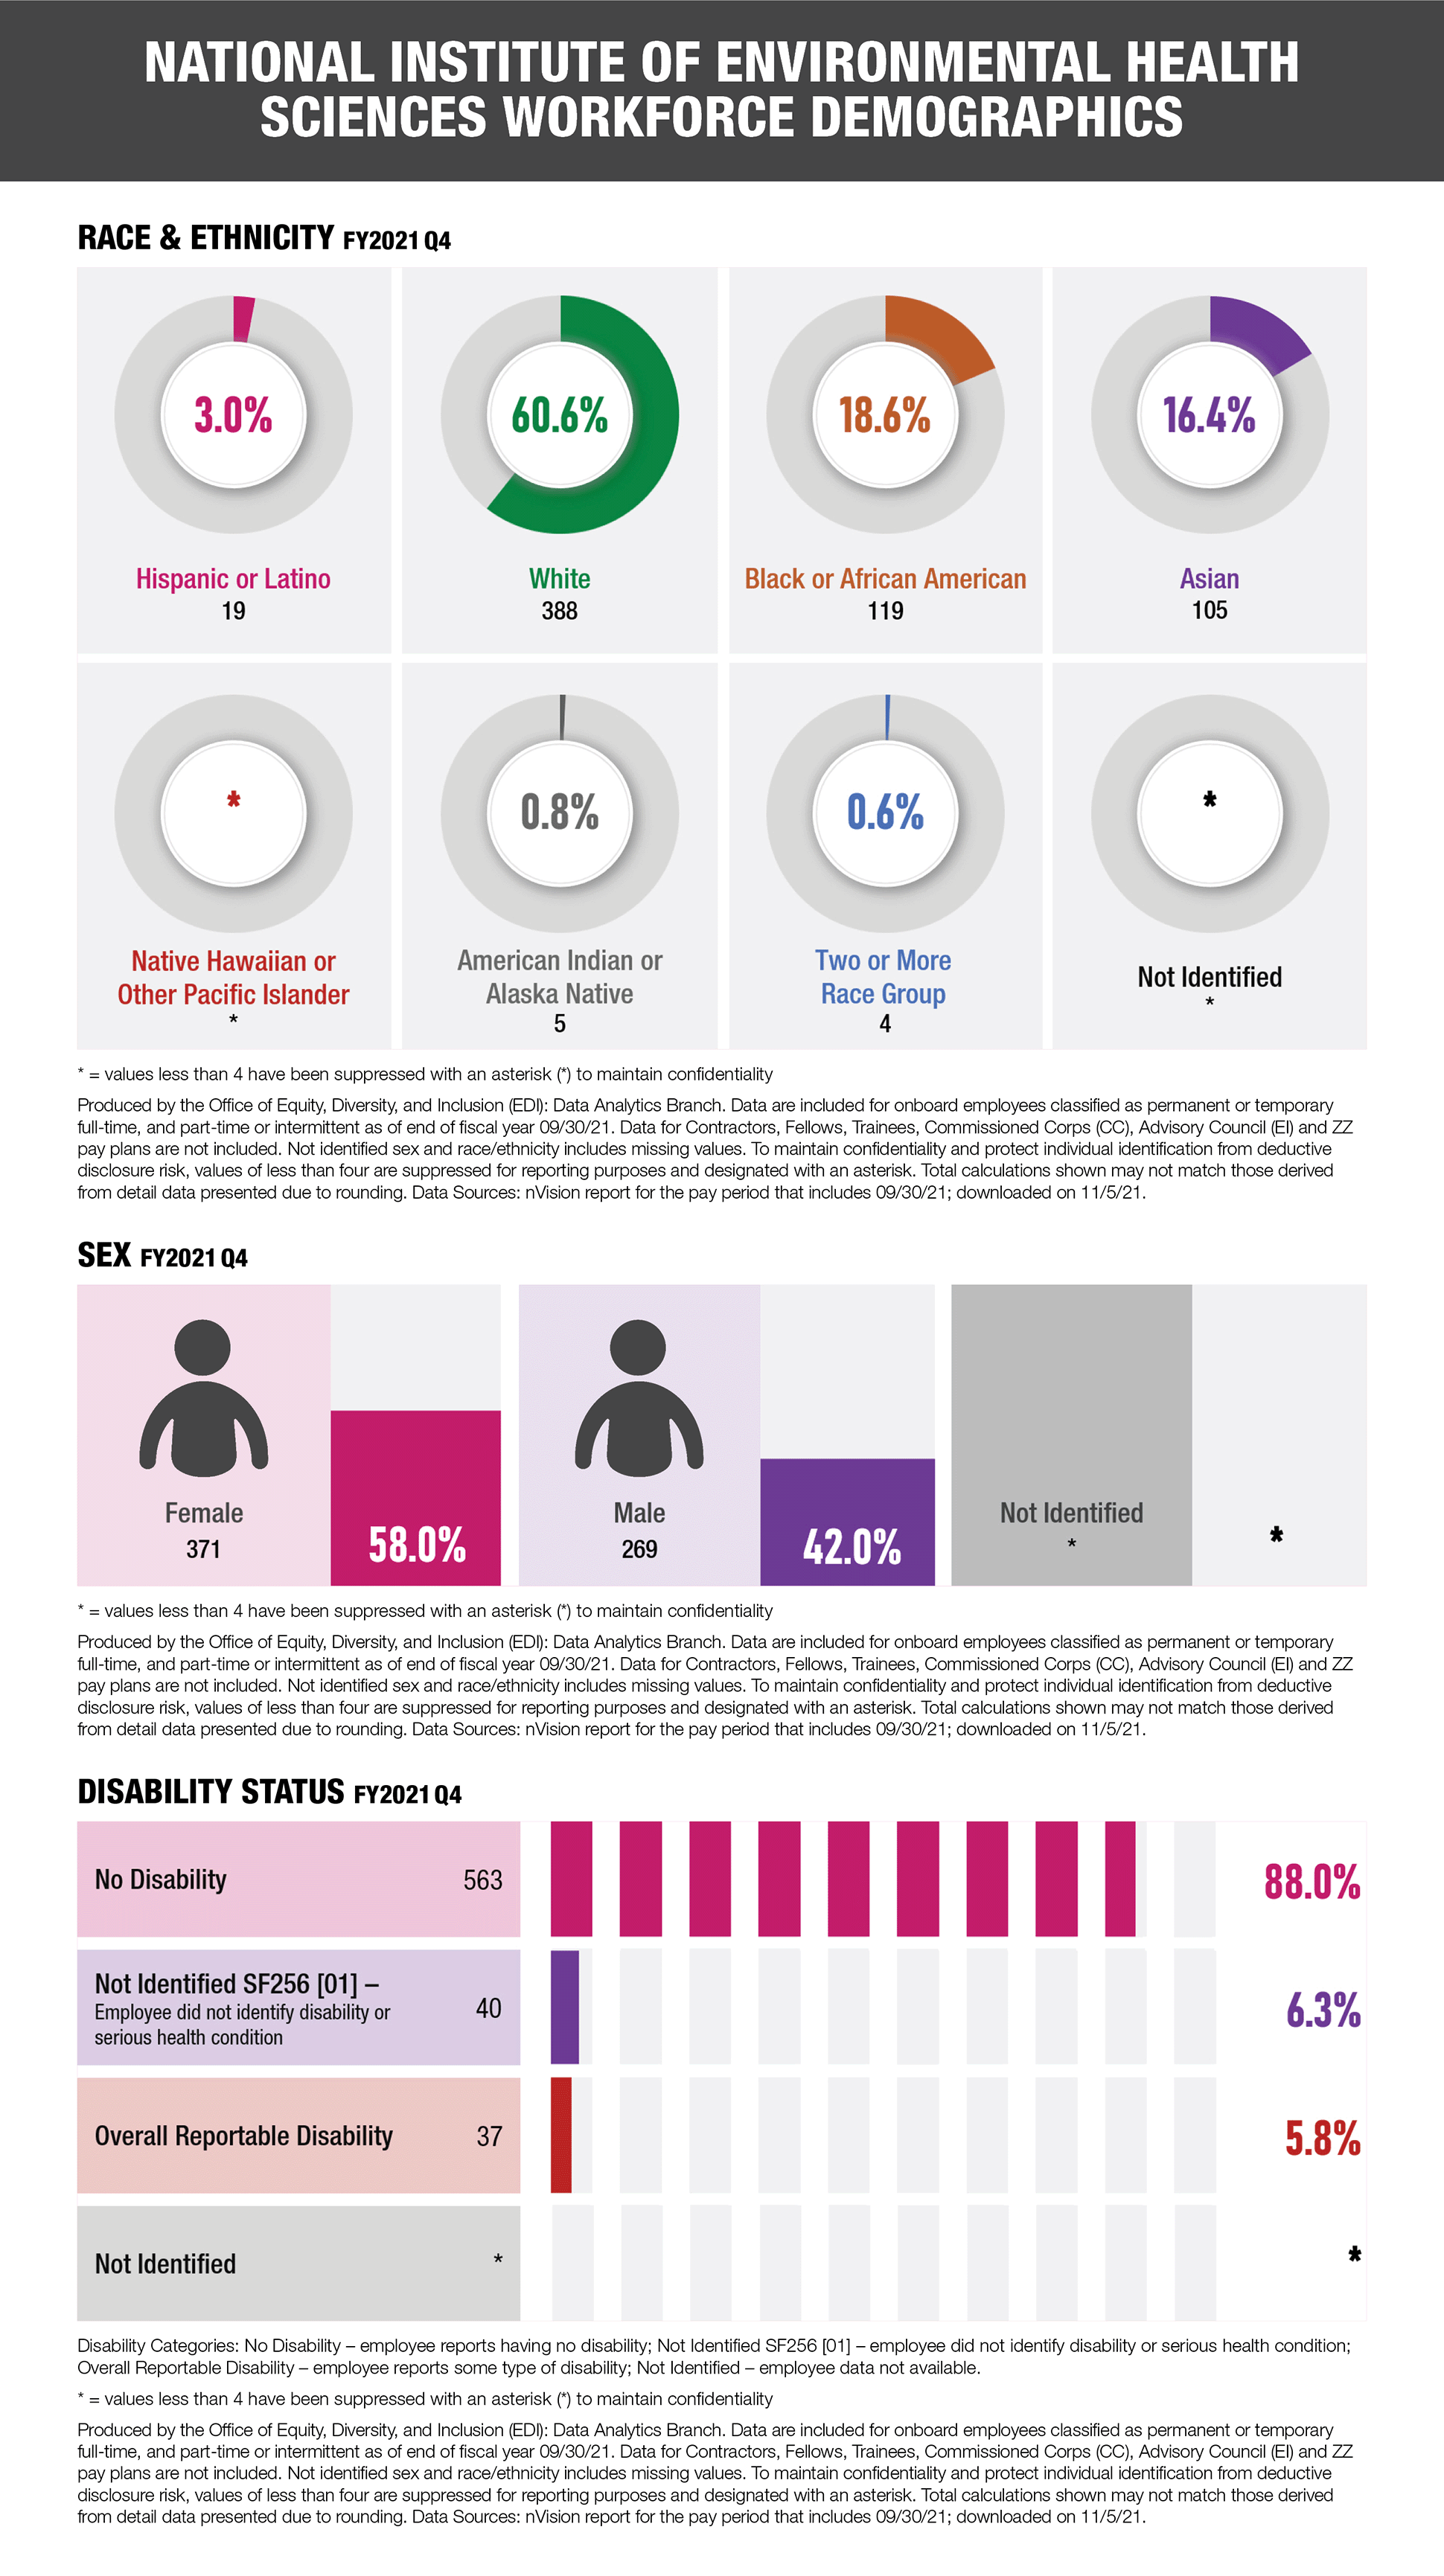
National Institute of Environmental Health Sciences Workforce Demographics
Three graphs representing data for the National Institute of Environmental Health Sciences Workforce Demographics for FY2021 Q4.
First graph showing race and ethnicity: Hispanic or Latino = 19 and 3.0%; White = 388 and 60.6%; Black or African American = 119 and 18.6%; Asian = 105 and 16.4%; Native Hawaiian or Pacific Islander = * and *%; American Indian or Alaska Native = 5 and 0.8%; Two or More Race Group = 4 and 0.6%; Not Identified = * and *%
Second graph showing Sex: Female = 371 and 58.0%; Male = 269 and 42.0%; Not Identified = * and *%
Third graph showing disability status: No disability = 563 and 88.0%; Not Identified SF256 [01] – employee did not identify disability or serious health condition= 40 and 6.3%; Overall Reportable Disability = 37 and 5.8%; Not Identified = * and *%
For all graphs: * = values less than 4 have been suppressed with an asterisk (*) to maintain confidentiality
All graphs are produced by the Office of Equity, Diversity, and Inclusion (EDI): Data Analytics Branch. Data are included for onboard employees classified as permanent or temporary full-time, and part-time or intermittent as of end of fiscal year 09/30/21. Data for Contractors, Fellows, Trainees, Commissioned Corps (CC), Advisory Council (EI) and ZZ pay plans are not included. Not identified sex and race/ethnicity includes missing values. To maintain confidentiality and protect individual identification from deductive disclosure risk, values of less than four are suppressed for reporting purposes and designated with an asterisk. Total calculations shown may not match those derived from detail data presented due to rounding. Data Sources: nVision report for the pay period that includes 09/30/21; downloaded on 11/5/21.
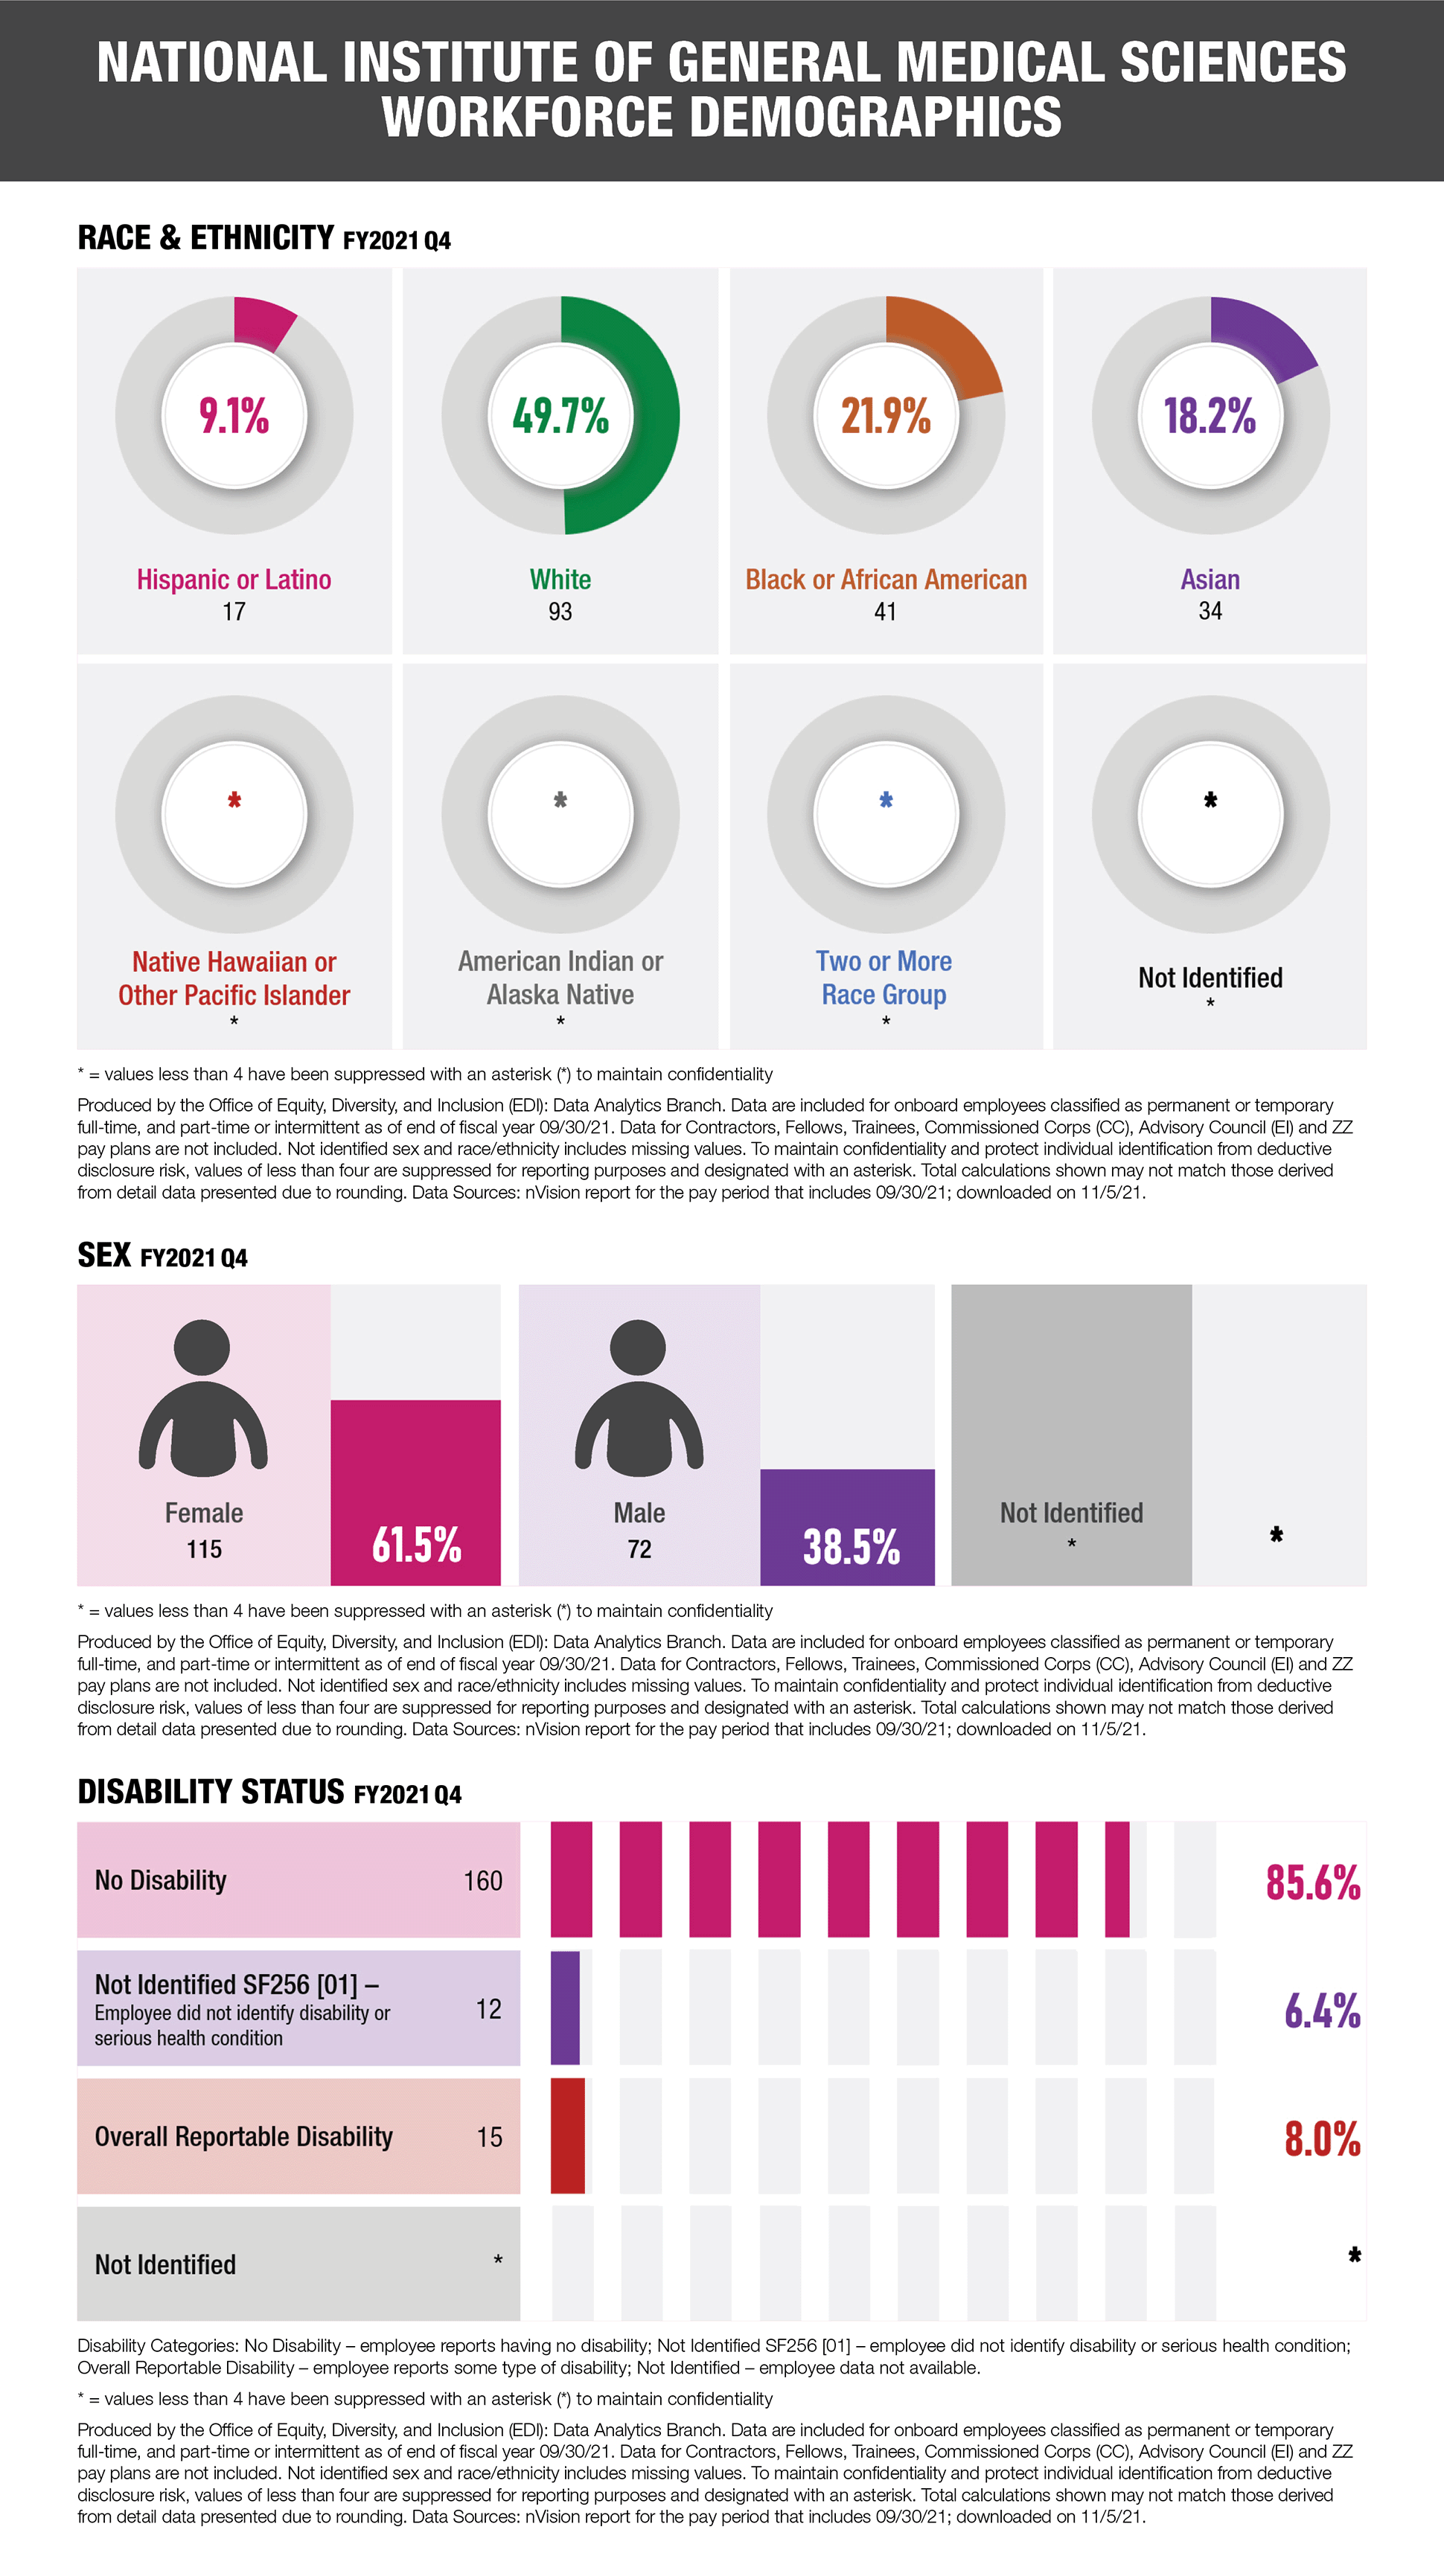
National Institute of General Medical Sciences Workforce Demographics
Three graphs representing data for the National Institute of General Medical Sciences Workforce Demographics for FY2021 Q4.
First graph showing race and ethnicity: Hispanic or Latino = 17 and 9.1%; White = 93 and 49.7%; Black or African American = 41 and 21.9%; Asian = 34 and 18.2%; Native Hawaiian or Pacific Islander = * and *%; American Indian or Alaska Native = * and *%; Two or More Race Group = * and *%; Not Identified = * and *%
Second graph showing Sex: Female = 115 and 61.5%; Male = 72 and 38.5%; Not Identified = * and *%
Third graph showing disability status: No disability = 160 and 85.6%; Not Identified SF256 [01] – employee did not identify disability or serious health condition= 12 and 6.4%; Overall Reportable Disability = 15 and 8.0%; Not Identified = * and *%
For all graphs: * = values less than 4 have been suppressed with an asterisk (*) to maintain confidentiality
All graphs are produced by the Office of Equity, Diversity, and Inclusion (EDI): Data Analytics Branch. Data are included for onboard employees classified as permanent or temporary full-time, and part-time or intermittent as of end of fiscal year 09/30/21. Data for Contractors, Fellows, Trainees, Commissioned Corps (CC), Advisory Council (EI) and ZZ pay plans are not included. Not identified sex and race/ethnicity includes missing values. To maintain confidentiality and protect individual identification from deductive disclosure risk, values of less than four are suppressed for reporting purposes and designated with an asterisk. Total calculations shown may not match those derived from detail data presented due to rounding. Data Sources: nVision report for the pay period that includes 09/30/21; downloaded on 11/5/21.
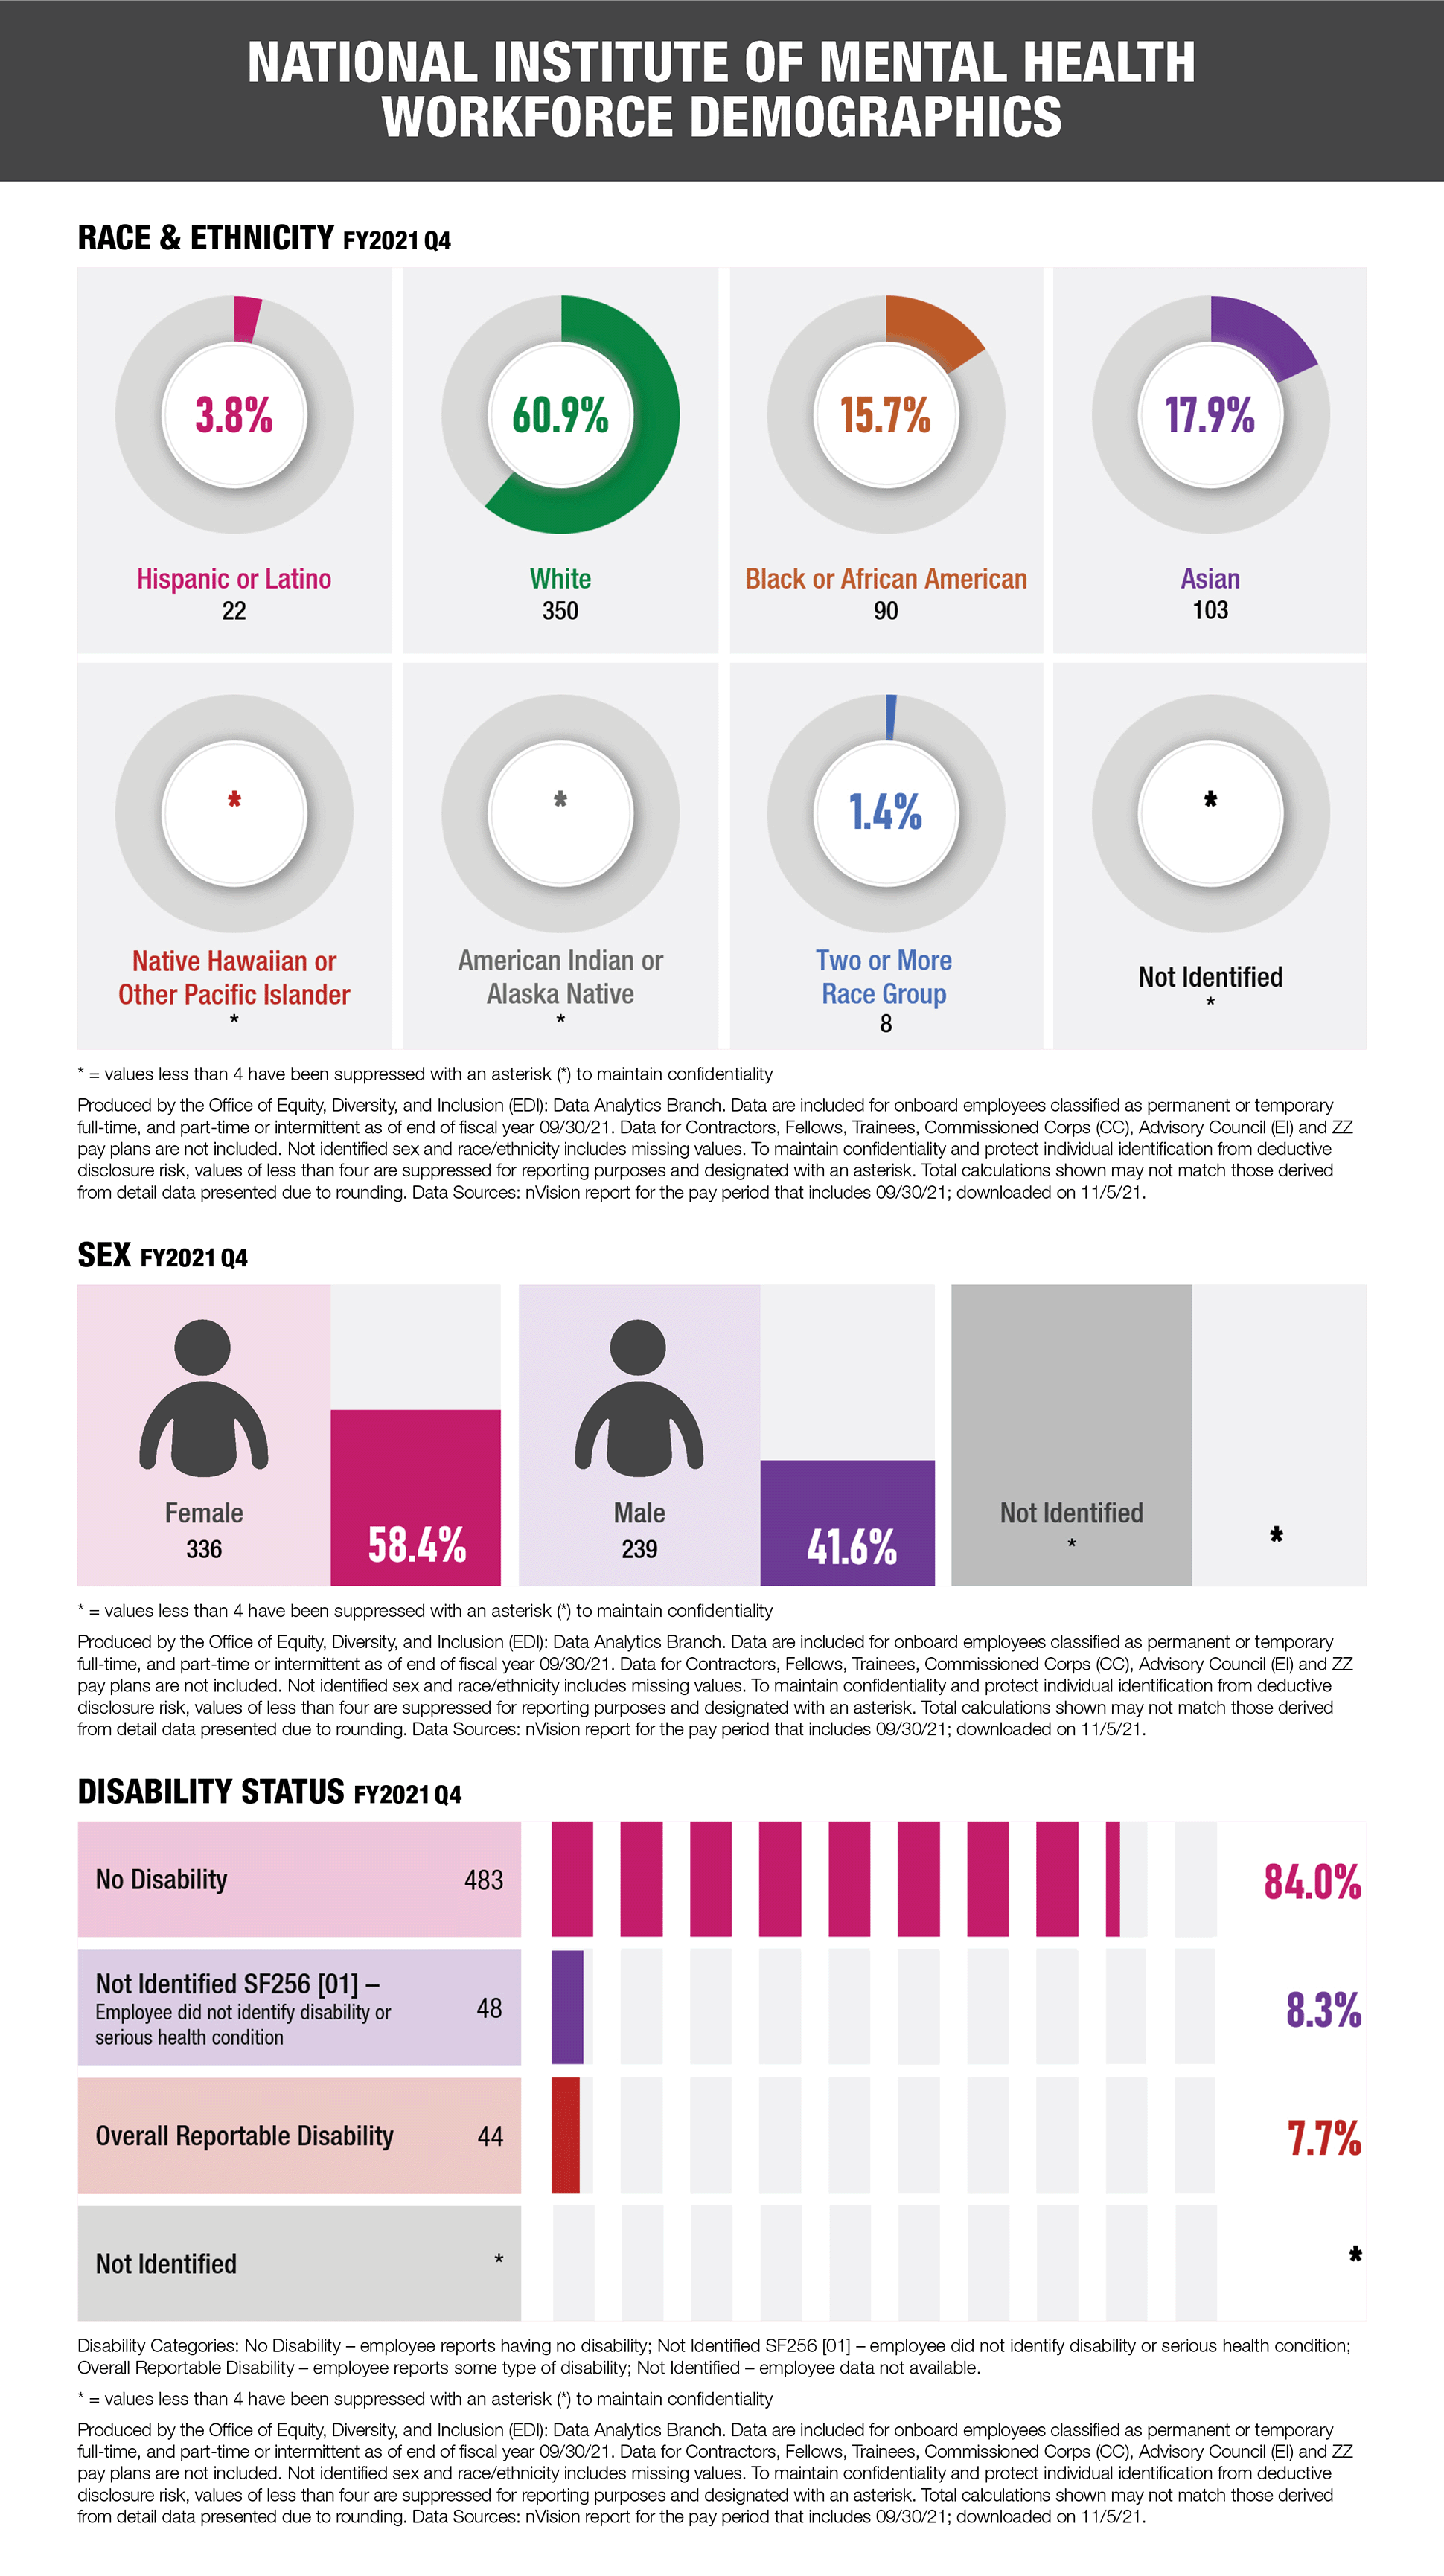
National Institute of Mental Health Workforce Demographics
Three graphs representing data for the National Institute of Mental Health Workforce Demographics for FY2021 Q4.
First graph showing race and ethnicity: Hispanic or Latino = 22 and 3.8%; White = 350 and 60.9%; Black or African American = 90 and 15.7%; Asian = 90 and 15.7%; Native Hawaiian or Pacific Islander = * and *%; American Indian or Alaska Native = * and *%; Two or More Race Group = 8 and 1.4%; Not Identified = * and *%
Second graph showing Sex: Female = 336 and 58.4%; Male = 239 and 41.6%; Not Identified = * and *%
Third graph showing disability status: No disability = 483 and 84.0%; Not Identified SF256 [01] – employee did not identify disability or serious health condition= 48 and 8.3%; Overall Reportable Disability = 44 and 7.7%; Not Identified = * and *%
For all graphs: * = values less than 4 have been suppressed with an asterisk (*) to maintain confidentiality
All graphs are produced by the Office of Equity, Diversity, and Inclusion (EDI): Data Analytics Branch. Data are included for onboard employees classified as permanent or temporary full-time, and part-time or intermittent as of end of fiscal year 09/30/21. Data for Contractors, Fellows, Trainees, Commissioned Corps (CC), Advisory Council (EI) and ZZ pay plans are not included. Not identified sex and race/ethnicity includes missing values. To maintain confidentiality and protect individual identification from deductive disclosure risk, values of less than four are suppressed for reporting purposes and designated with an asterisk. Total calculations shown may not match those derived from detail data presented due to rounding. Data Sources: nVision report for the pay period that includes 09/30/21; downloaded on 11/5/21.

National Institute on Minority Health and Health Disparities Workforce Demographics
Three graphs representing data for the National Institute on Minority Health and Health Disparities Workforce Demographics for FY2021 Q4.
First graph showing race and ethnicity: Hispanic or Latino = 6 and 8.8%; White = 26 and 38.2%; Black or African American = 26 and 38.2%; Asian = 8 and 11.8%; Native Hawaiian or Pacific Islander = * and *%; American Indian or Alaska Native = * and *%; Two or More Race Group = * and *%; Not Identified = * and *%
Second graph showing Sex: Female = 50 and 73.5%; Male = 18 and 26.5%; Not Identified = * and *%
Third graph showing disability status: No disability = 62 and 91.2%; Not Identified SF256 [01] – employee did not identify disability or serious health condition= * and *%; Overall Reportable Disability = * and *%; Not Identified = * and *%
For all graphs: * = values less than 4 have been suppressed with an asterisk (*) to maintain confidentiality
All graphs are produced by the Office of Equity, Diversity, and Inclusion (EDI): Data Analytics Branch. Data are included for onboard employees classified as permanent or temporary full-time, and part-time or intermittent as of end of fiscal year 09/30/21. Data for Contractors, Fellows, Trainees, Commissioned Corps (CC), Advisory Council (EI) and ZZ pay plans are not included. Not identified sex and race/ethnicity includes missing values. To maintain confidentiality and protect individual identification from deductive disclosure risk, values of less than four are suppressed for reporting purposes and designated with an asterisk. Total calculations shown may not match those derived from detail data presented due to rounding. Data Sources: nVision report for the pay period that includes 09/30/21; downloaded on 11/5/21.

National Institute of Neurological Disorders and Stroke Workforce Demographics
Three graphs representing data for the National Institute of Neurological Disorders and Stroke Workforce Demographics for FY2021 Q4.
First graph showing race and ethnicity: Hispanic or Latino = 24 and 4.1%; White = 348 and 60.1%; Black or African American = 78 and 13.5%; Asian = 125 and 21.6%; Native Hawaiian or Pacific Islander = * and *%; American Indian or Alaska Native = * and *%; Two or More Race Group = * and *%; Not Identified = * and *%
Second graph showing Sex: Female = 356 and 61.5%; Male = 223 and 38.5%; Not Identified = * and *%
Third graph showing disability status: No disability = 507 and 87.6%; Not Identified SF256 [01] – employee did not identify disability or serious health condition= 29 and 5.0%; Overall Reportable Disability = 43 and 7.4%; Not Identified = * and *%
For all graphs: * = values less than 4 have been suppressed with an asterisk (*) to maintain confidentiality
All graphs are produced by the Office of Equity, Diversity, and Inclusion (EDI): Data Analytics Branch. Data are included for onboard employees classified as permanent or temporary full-time, and part-time or intermittent as of end of fiscal year 09/30/21. Data for Contractors, Fellows, Trainees, Commissioned Corps (CC), Advisory Council (EI) and ZZ pay plans are not included. Not identified sex and race/ethnicity includes missing values. To maintain confidentiality and protect individual identification from deductive disclosure risk, values of less than four are suppressed for reporting purposes and designated with an asterisk. Total calculations shown may not match those derived from detail data presented due to rounding. Data Sources: nVision report for the pay period that includes 09/30/21; downloaded on 11/5/21.

National Institute of Nursing Research Workforce Demographics
Three graphs representing data for the National Institute of Nursing Research Workforce Demographics for FY2021 Q4.
First graph showing race and ethnicity: Hispanic or Latino = * and *%; White = 51 and 60.7%; Black or African American = 17 and 20.2%; Asian = 10 and 11.9%; Native Hawaiian or Pacific Islander = * and *%; American Indian or Alaska Native = * and *%; Two or More Race Group = * and *%; Not Identified = * and *%
Second graph showing Sex: Female = 52 and 61.9%; Male = 32 and 38.1%; Not Identified = * and *%
Third graph showing disability status: No disability = 65 and 77.4%; Not Identified SF256 [01] – employee did not identify disability or serious health condition= 6 and 7.1%; Overall Reportable Disability = 13 and 15.5%; Not Identified = * and *%
For all graphs: * = values less than 4 have been suppressed with an asterisk (*) to maintain confidentiality
All graphs are produced by the Office of Equity, Diversity, and Inclusion (EDI): Data Analytics Branch. Data are included for onboard employees classified as permanent or temporary full-time, and part-time or intermittent as of end of fiscal year 09/30/21. Data for Contractors, Fellows, Trainees, Commissioned Corps (CC), Advisory Council (EI) and ZZ pay plans are not included. Not identified sex and race/ethnicity includes missing values. To maintain confidentiality and protect individual identification from deductive disclosure risk, values of less than four are suppressed for reporting purposes and designated with an asterisk. Total calculations shown may not match those derived from detail data presented due to rounding. Data Sources: nVision report for the pay period that includes 09/30/21; downloaded on 11/5/21.
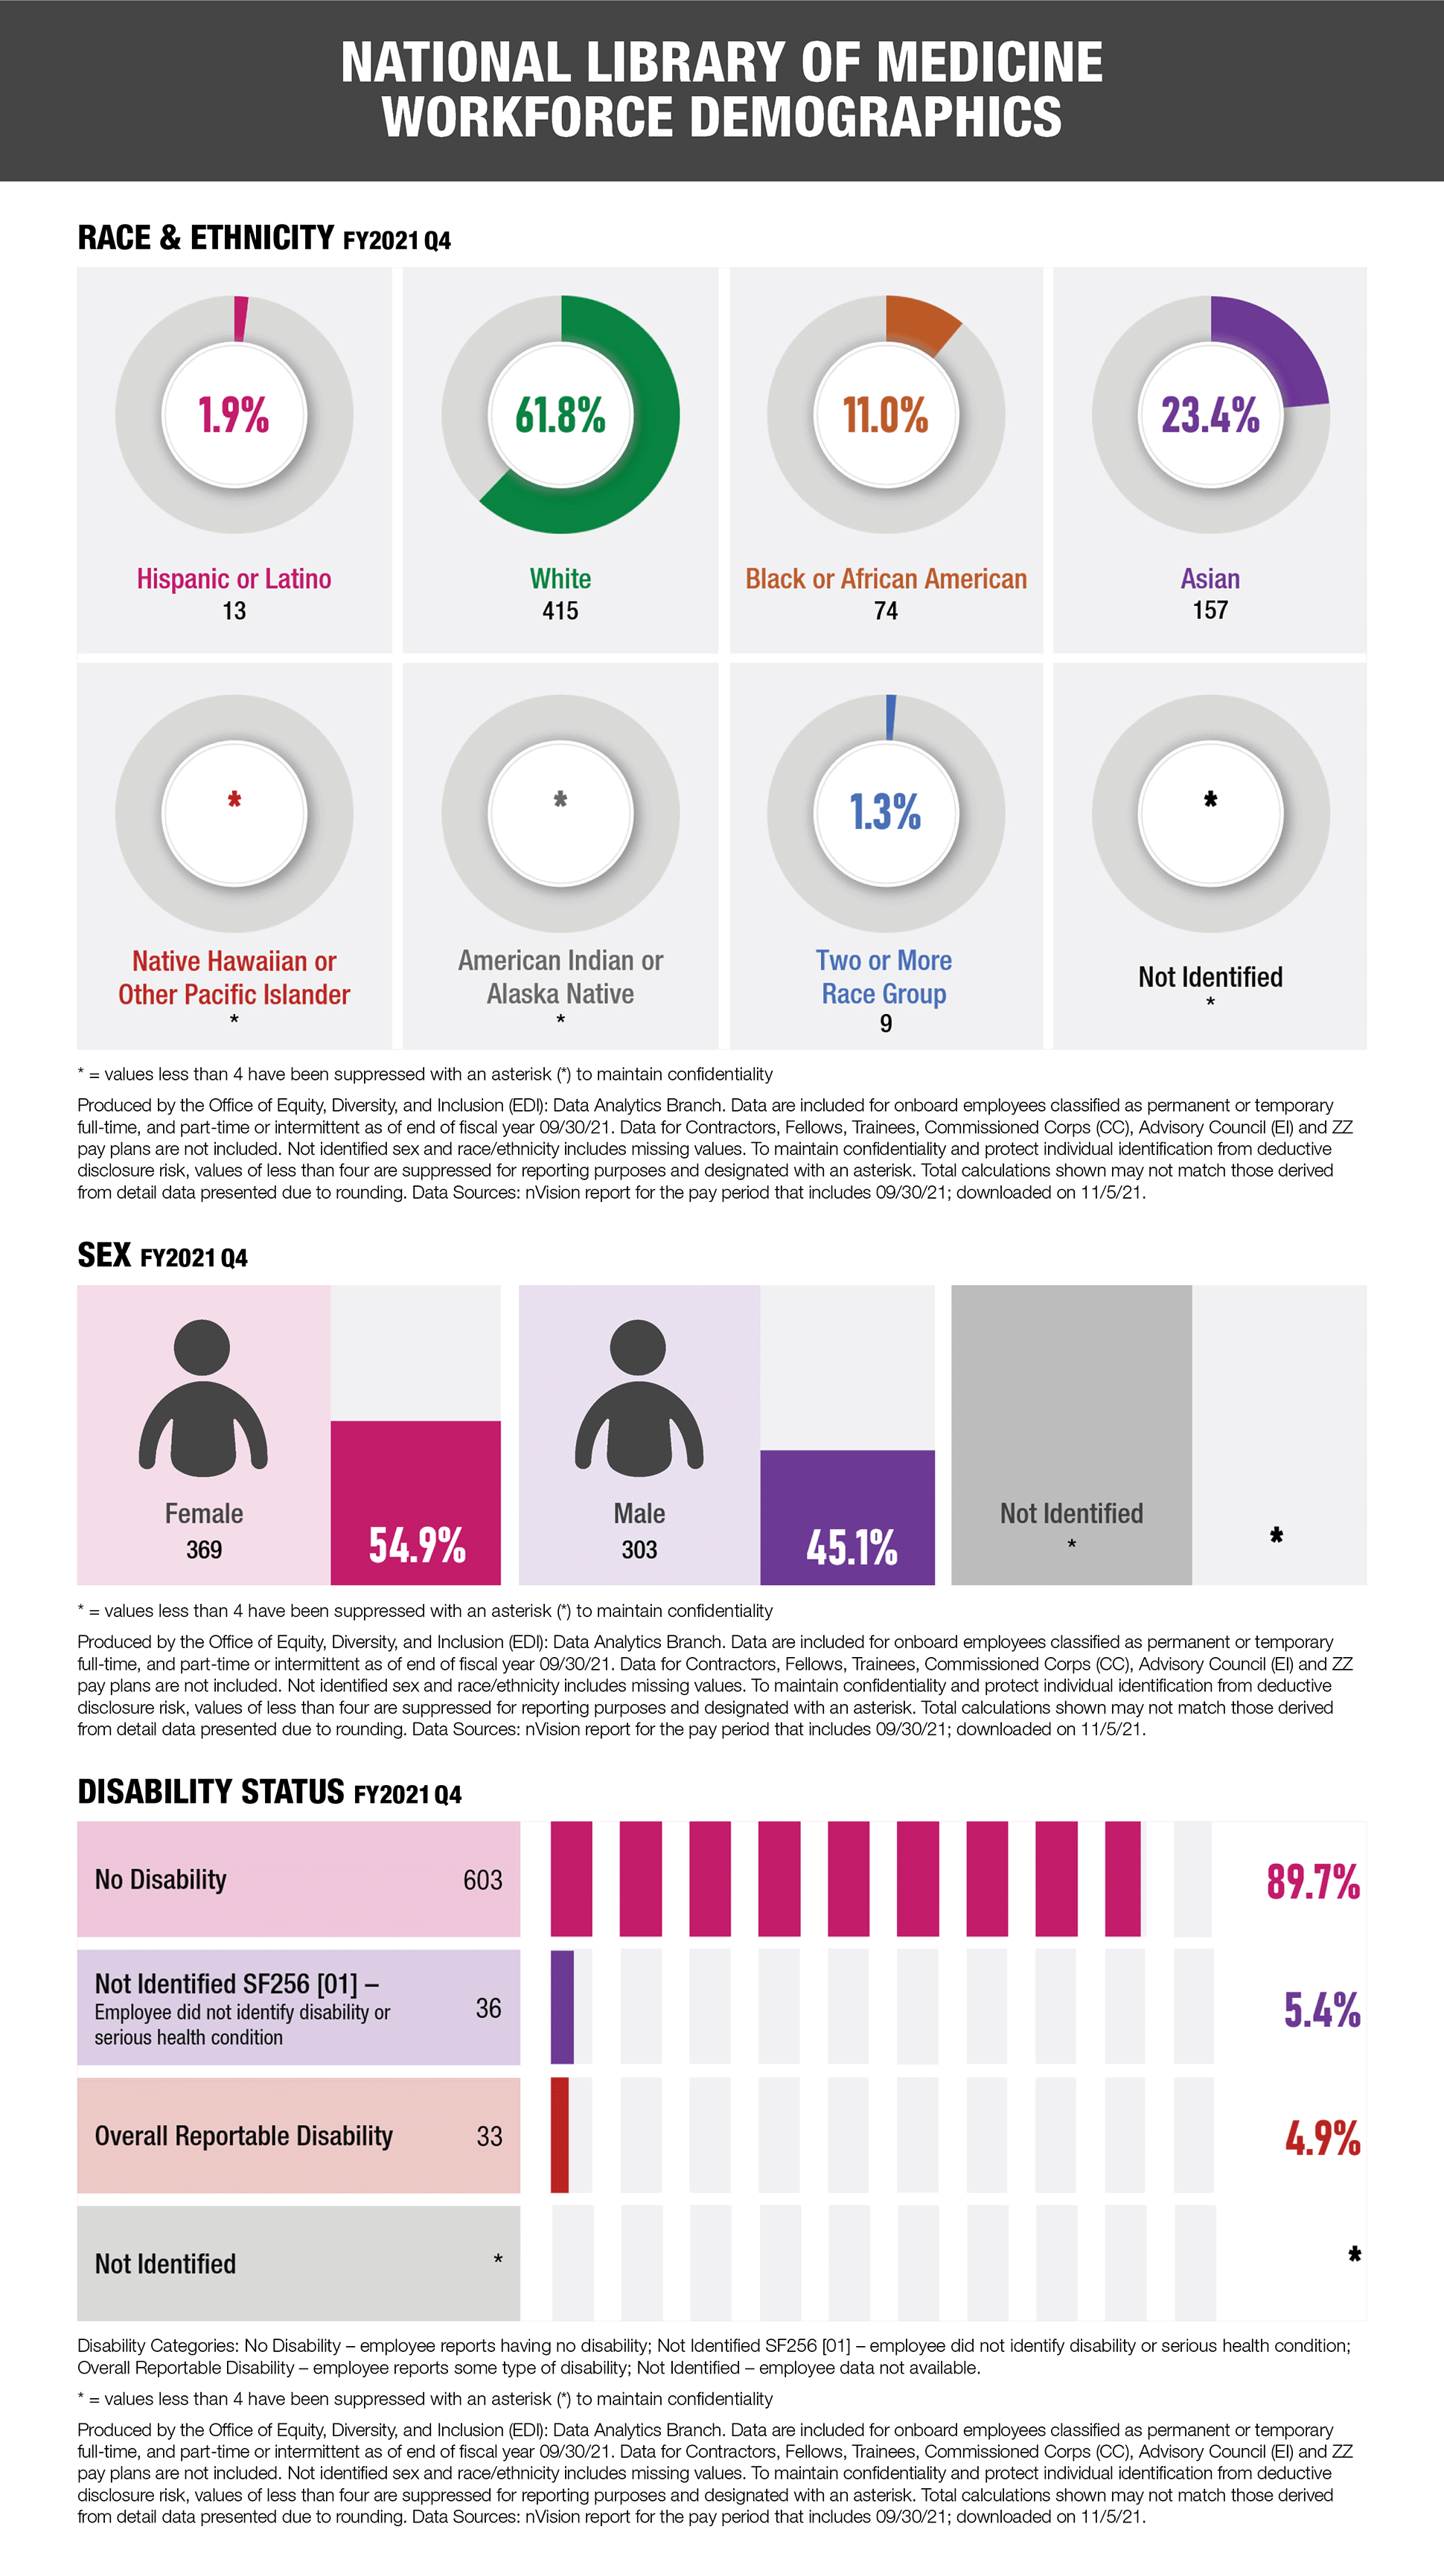
National Libraray of Medicine Workforce Demographics
Three graphs representing data for the National Library of Medicine Workforce Demographics for FY2021 Q4.
First graph showing race and ethnicity: Hispanic or Latino = 13 and 1.9%; White = 415 and 61.8%; Black or African American = 74 and 11.0%; Asian = 157 and 23.4%; Native Hawaiian or Pacific Islander = * and *%; American Indian or Alaska Native = * and *%; Two or More Race Group = 9 and 1.3%; Not Identified = * and *%
Second graph showing Sex: Female = 369 and 54.9%; Male = 303 and 45.1%; Not Identified = * and *%
Third graph showing disability status: No disability = 603 and 89.7%; Not Identified SF256 [01] – employee did not identify disability or serious health condition= 36 and 5.4%; Overall Reportable Disability = 33 and 4.9%; Not Identified = * and *%
For all graphs: * = values less than 4 have been suppressed with an asterisk (*) to maintain confidentiality
All graphs are produced by the Office of Equity, Diversity, and Inclusion (EDI): Data Analytics Branch. Data are included for onboard employees classified as permanent or temporary full-time, and part-time or intermittent as of end of fiscal year 09/30/21. Data for Contractors, Fellows, Trainees, Commissioned Corps (CC), Advisory Council (EI) and ZZ pay plans are not included. Not identified sex and race/ethnicity includes missing values. To maintain confidentiality and protect individual identification from deductive disclosure risk, values of less than four are suppressed for reporting purposes and designated with an asterisk. Total calculations shown may not match those derived from detail data presented due to rounding. Data Sources: nVision report for the pay period that includes 09/30/21; downloaded on 11/5/21.
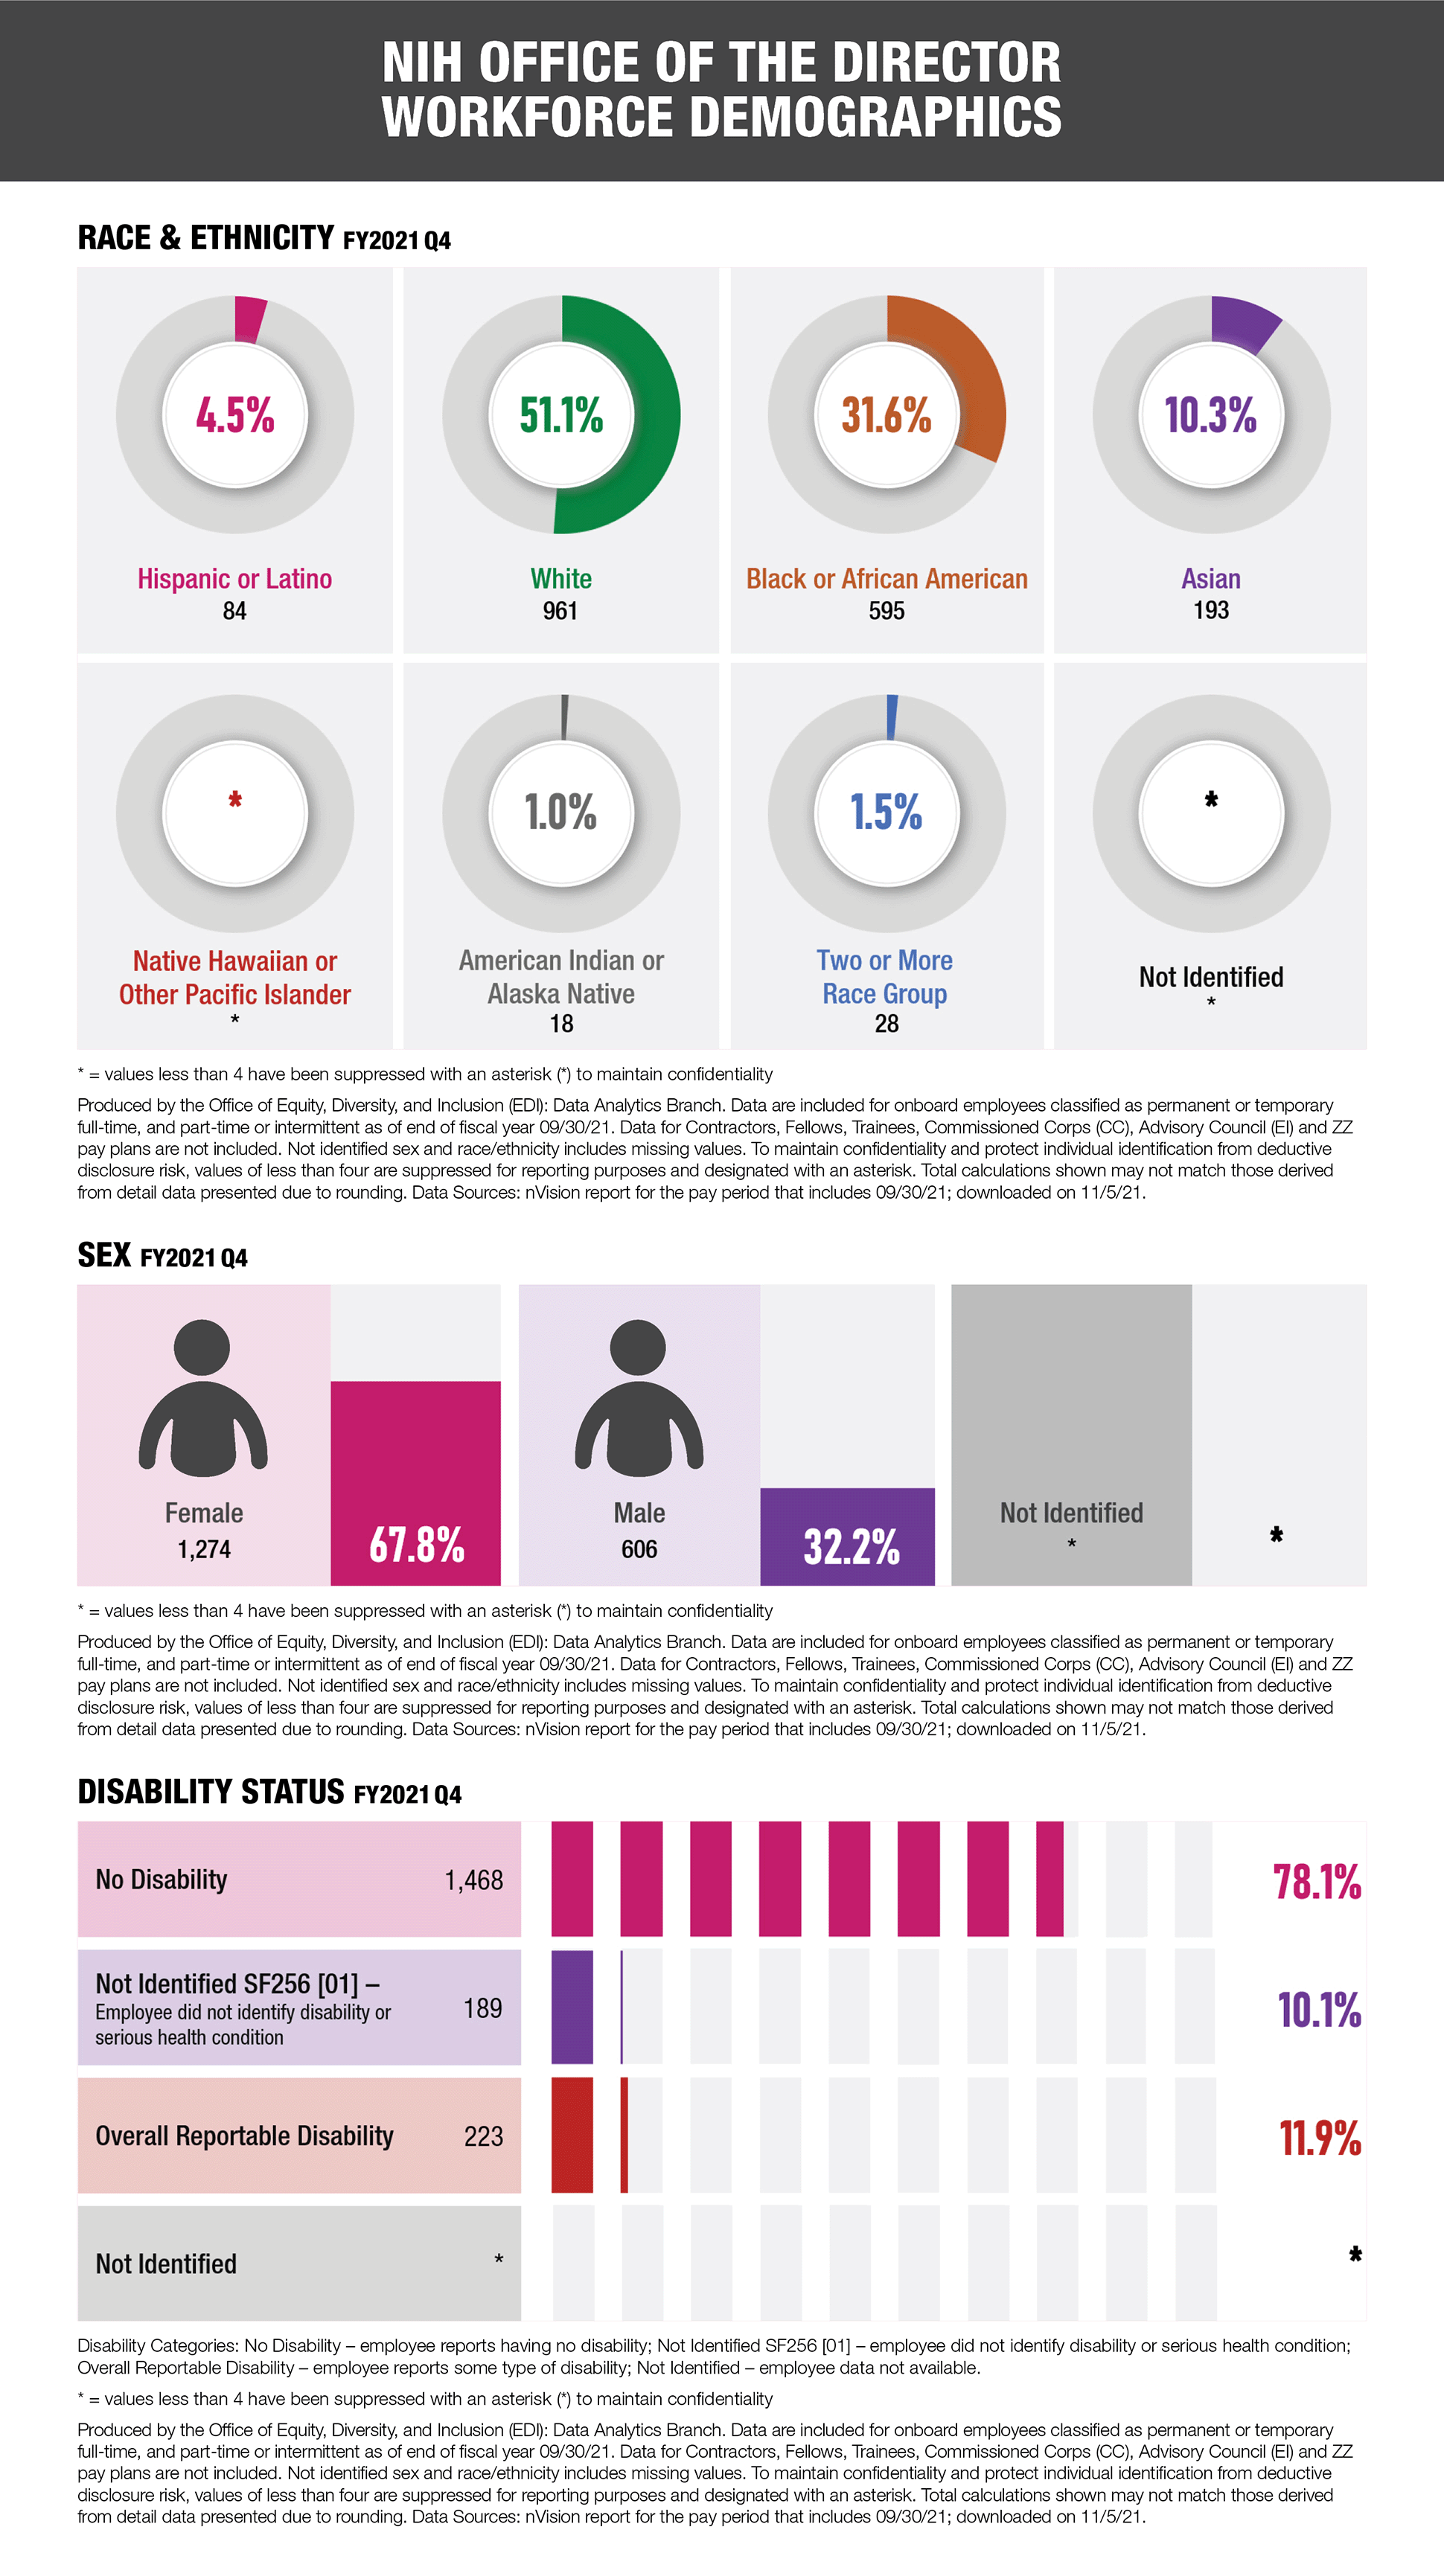
National Institutes of Health Office of the Director Workforce Demographics
Three graphs representing data for the National Institutes of Health Office of the Director Workforce Demographics for FY2021 Q4.
First graph showing race and ethnicity: Hispanic or Latino = 84 and 4.5%; White = 961 and 51.1%; Black or African American = 595 and 31.6%; Asian = 193 and 10.3%; Native Hawaiian or Pacific Islander = * and *%; American Indian or Alaska Native = 18 and 1.0%; Two or More Race Group = 28 and 1.5%; Not Identified = * and *%
Second graph showing Sex: Female = 1,274 and 67.8%; Male = 606 and 32.2%; Not Identified = * and *%
Third graph showing disability status: No disability = 1,468 and 78.1%; Not Identified SF256 [01] – employee did not identify disability or serious health condition= 189 and 10.1%; Overall Reportable Disability = 223 and 11.9%; Not Identified = * and *%
For all graphs: * = values less than 4 have been suppressed with an asterisk (*) to maintain confidentiality
All graphs are produced by the Office of Equity, Diversity, and Inclusion (EDI): Data Analytics Branch. Data are included for onboard employees classified as permanent or temporary full-time, and part-time or intermittent as of end of fiscal year 09/30/21. Data for Contractors, Fellows, Trainees, Commissioned Corps (CC), Advisory Council (EI) and ZZ pay plans are not included. Not identified sex and race/ethnicity includes missing values. To maintain confidentiality and protect individual identification from deductive disclosure risk, values of less than four are suppressed for reporting purposes and designated with an asterisk. Total calculations shown may not match those derived from detail data presented due to rounding. Data Sources: nVision report for the pay period that includes 09/30/21; downloaded on 11/5/21.
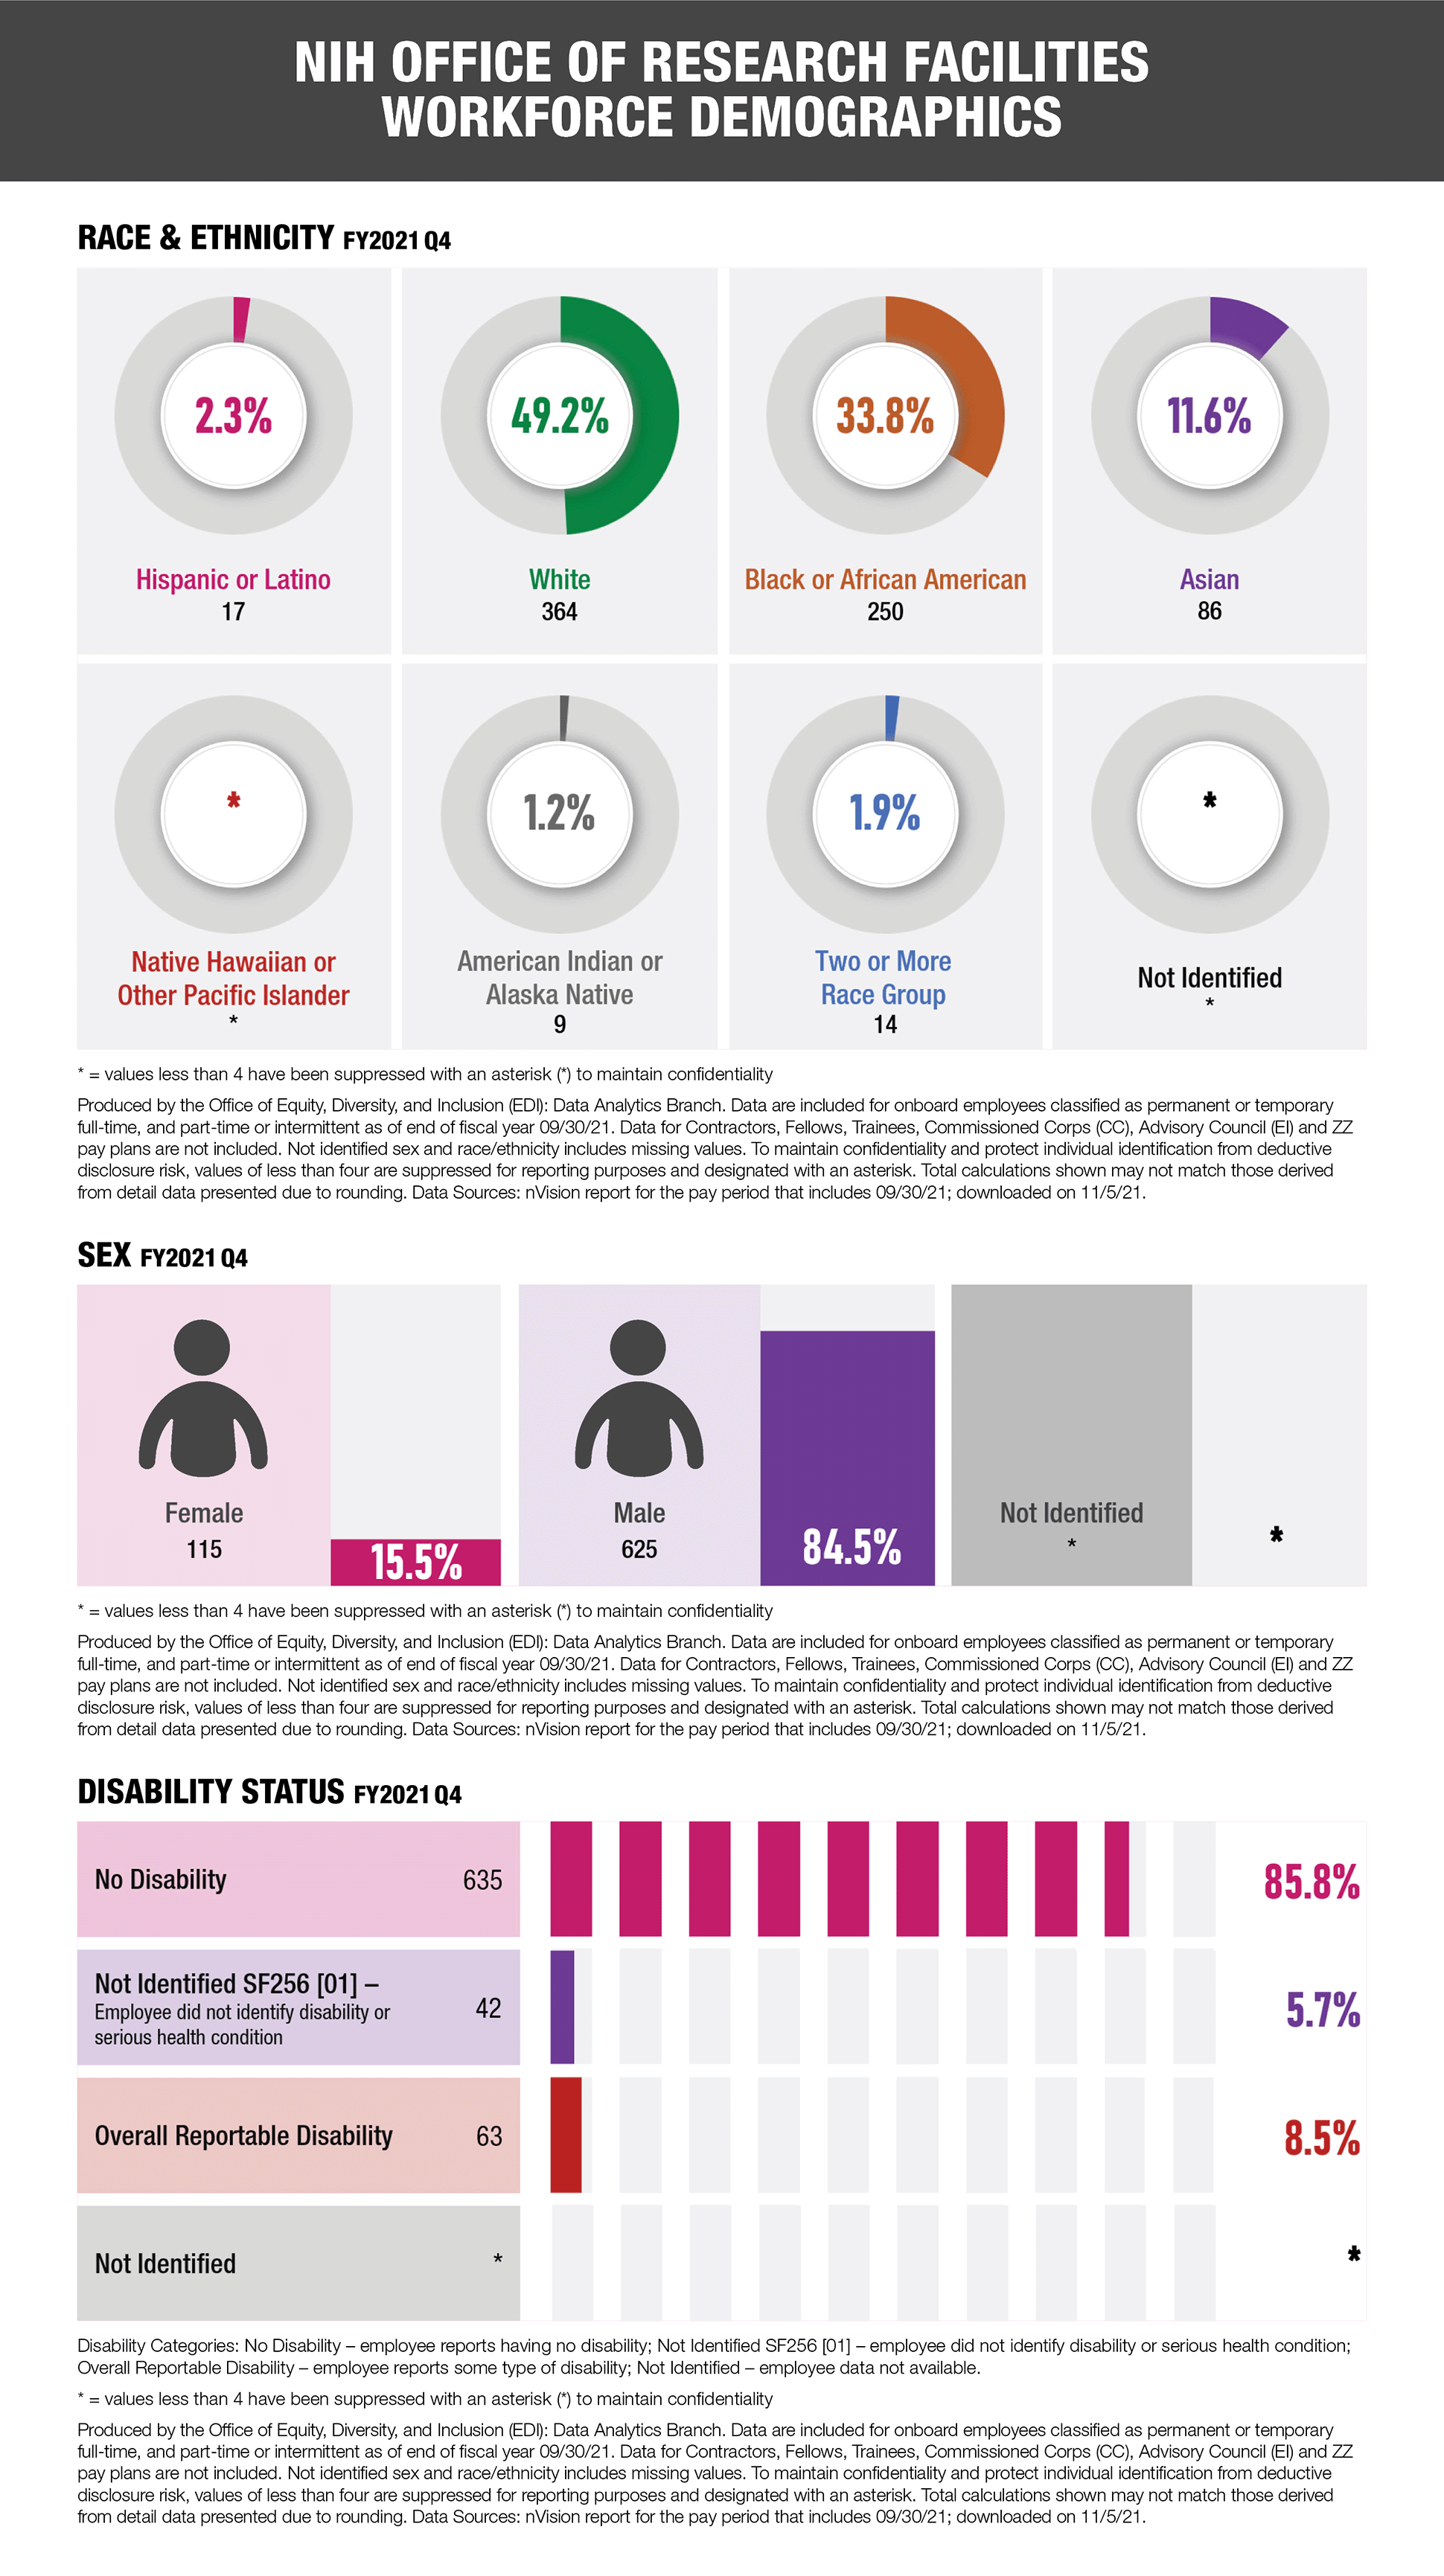
National Institutes of Health Office of Research Facilities Workforce Demographics
Three graphs representing data for the National Institutes of Health Office of Research Facilities Workforce Demographics for FY2021 Q4.
First graph showing race and ethnicity: Hispanic or Latino = 17 and 2.3%; White = 364 and 49.2%; Black or African American = 250 and 33.8%; Asian = 86 and 11.6%; Native Hawaiian or Pacific Islander = * and *%; American Indian or Alaska Native = 9 and 1.2%; Two or More Race Group = 14 and 1.9%; Not Identified = * and *%
Second graph showing Sex: Female = 115 and 15.5%; Male = 625 and 84.5%; Not Identified = * and *%
Third graph showing disability status: No disability = 635 and 85.8%; Not Identified SF256 [01] – employee did not identify disability or serious health condition= 42 and 5.7%; Overall Reportable Disability = 63 and 8.5%; Not Identified = * and *%
For all graphs: * = values less than 4 have been suppressed with an asterisk (*) to maintain confidentiality
All graphs are produced by the Office of Equity, Diversity, and Inclusion (EDI): Data Analytics Branch. Data are included for onboard employees classified as permanent or temporary full-time, and part-time or intermittent as of end of fiscal year 09/30/21. Data for Contractors, Fellows, Trainees, Commissioned Corps (CC), Advisory Council (EI) and ZZ pay plans are not included. Not identified sex and race/ethnicity includes missing values. To maintain confidentiality and protect individual identification from deductive disclosure risk, values of less than four are suppressed for reporting purposes and designated with an asterisk. Total calculations shown may not match those derived from detail data presented due to rounding. Data Sources: nVision report for the pay period that includes 09/30/21; downloaded on 11/5/21.
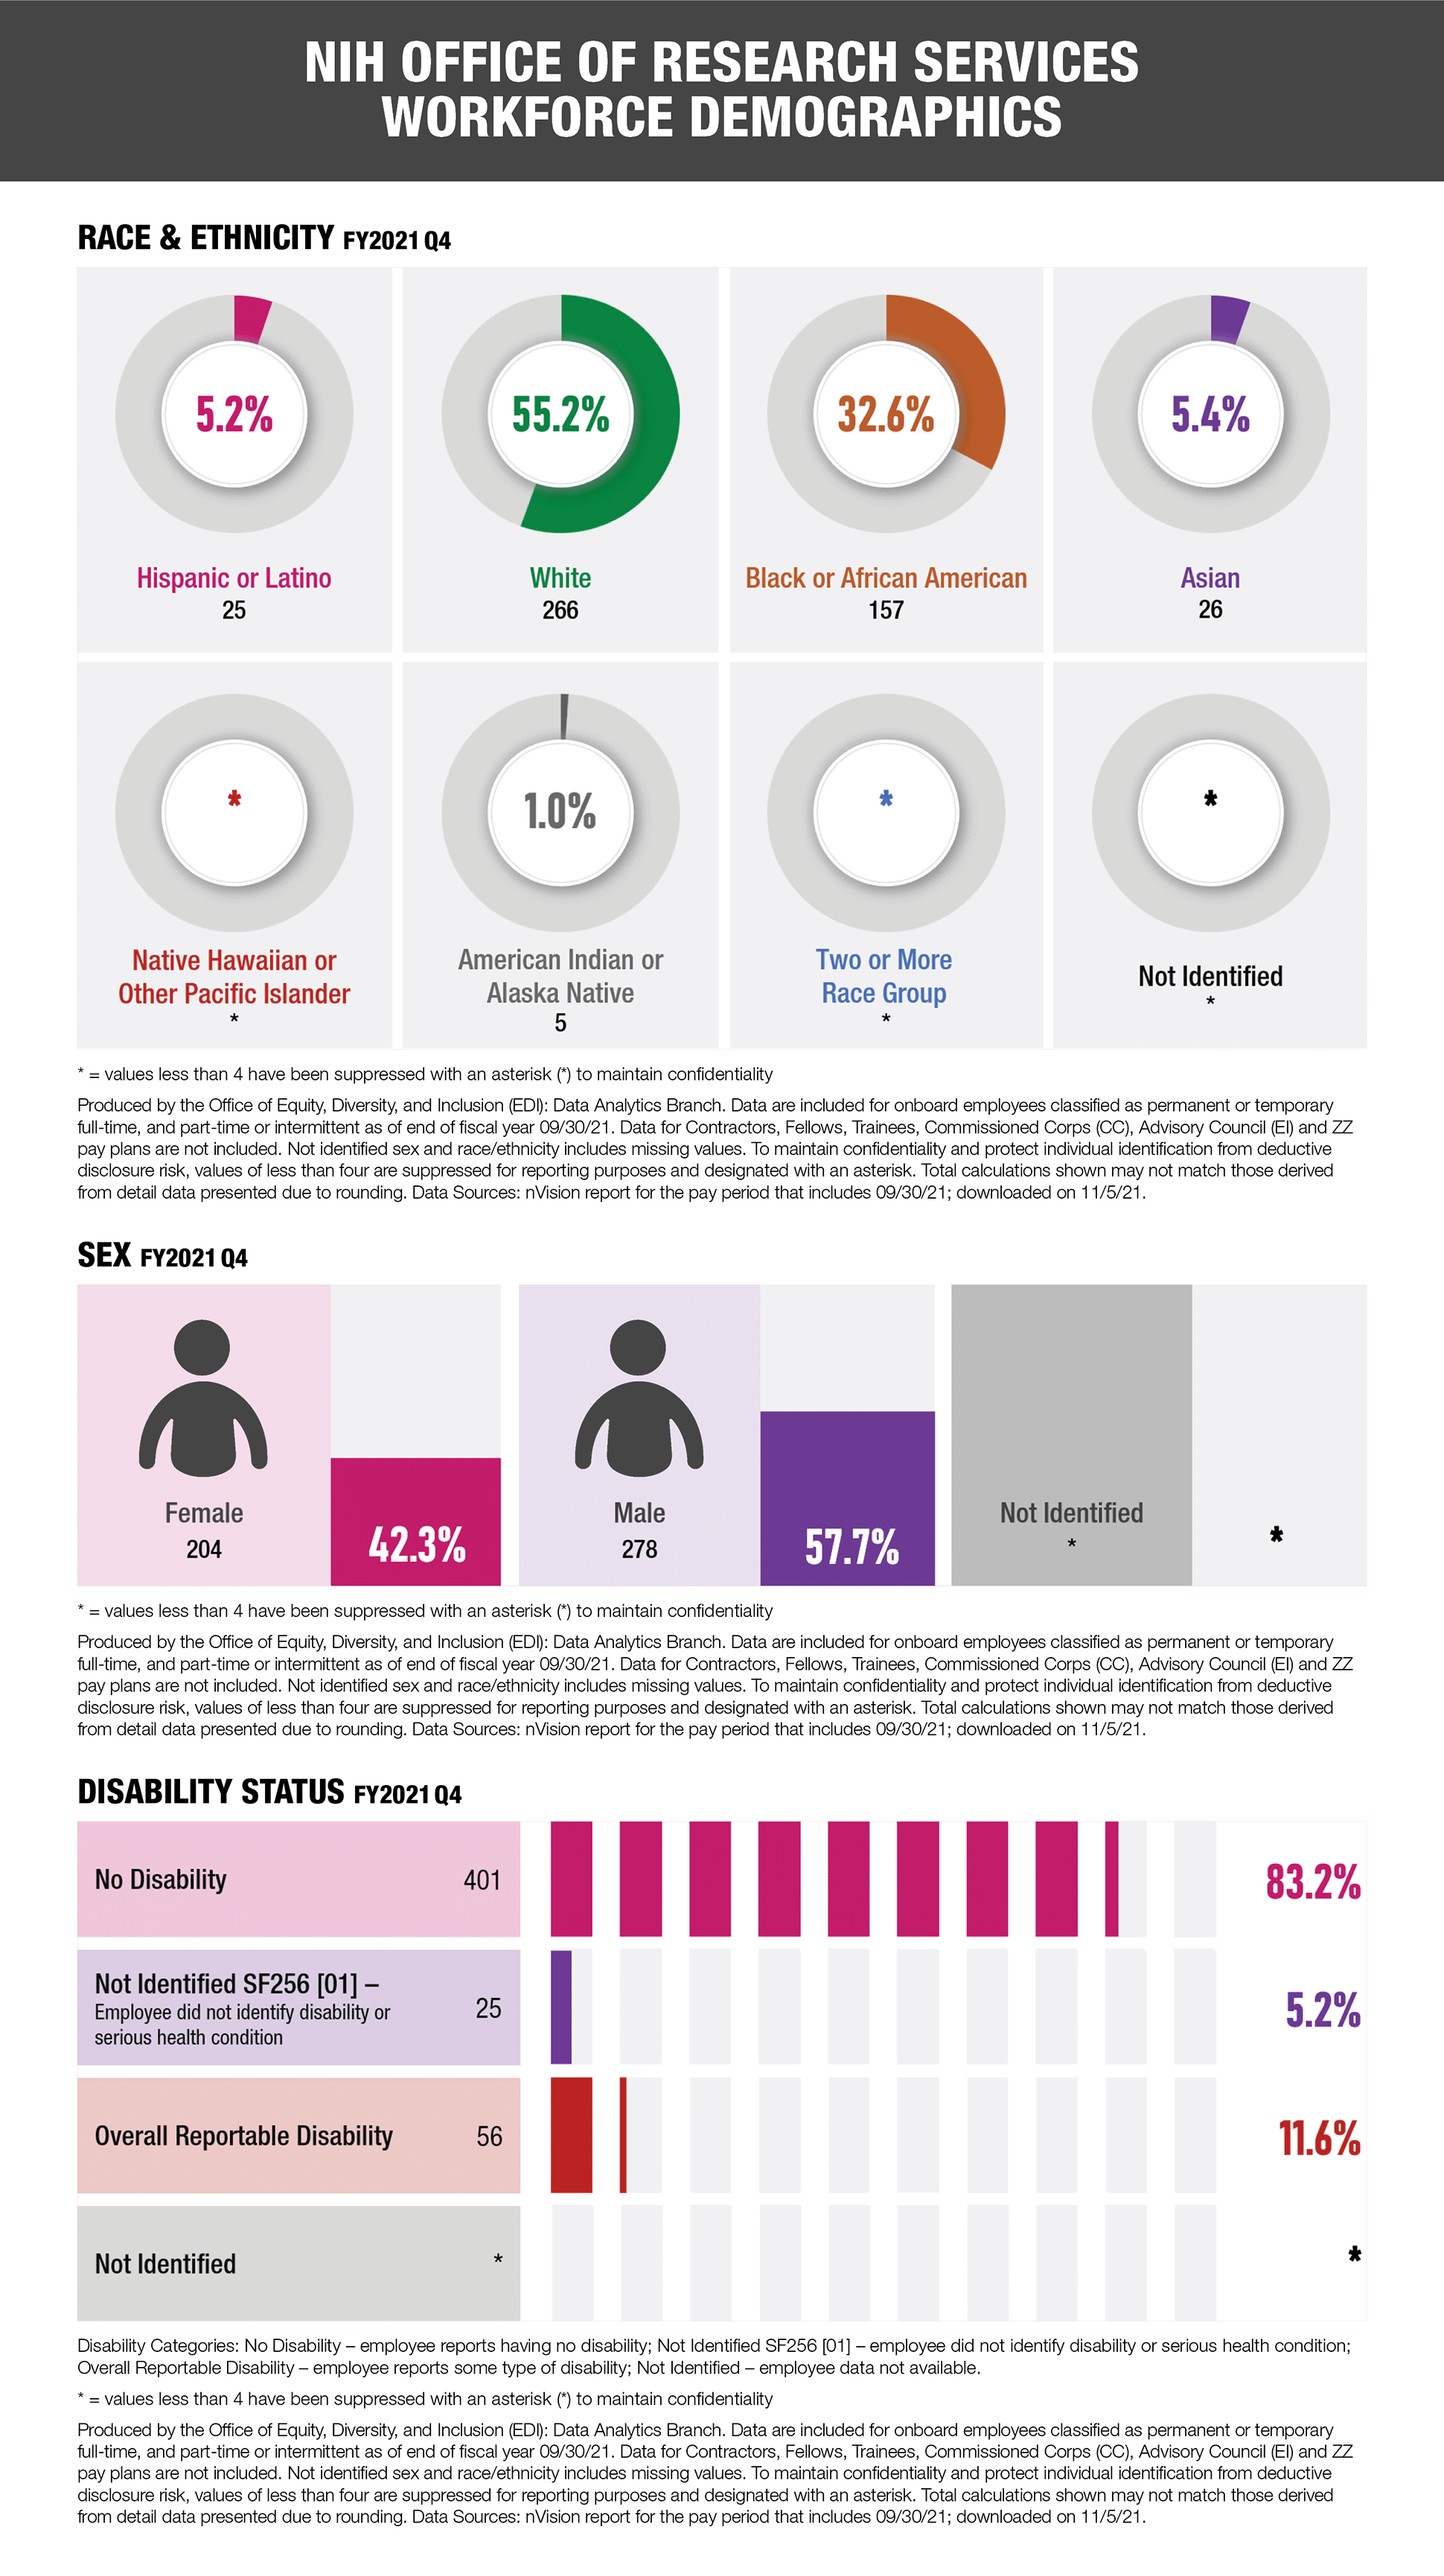
National Institutes of Health Office of Research Services Workforce Demographics
Three graphs representing data for the National Institutes of Health Office of Research Services Workforce Demographics for FY2021 Q4.
First graph showing race and ethnicity: Hispanic or Latino = 25 and 5.2%; White = 266 and 55.2%; Black or African American = 157 and 32.6%; Asian = 26 and 5.4%; Native Hawaiian or Pacific Islander = * and *%; American Indian or Alaska Native = 5 and 1.0%; Two or More Race Group = * and *%; Not Identified = * and *%
Second graph showing Sex: Female = 204 and 42.3%; Male = 278 and 57.7%; Not Identified = * and *%
Third graph showing disability status: No disability = 401 and 83.2%; Not Identified SF256 [01] – employee did not identify disability or serious health condition= 25 and 5.2%; Overall Reportable Disability = 56 and 11.6%; Not Identified = * and *%
For all graphs: * = values less than 4 have been suppressed with an asterisk (*) to maintain confidentiality
All graphs are produced by the Office of Equity, Diversity, and Inclusion (EDI): Data Analytics Branch. Data are included for onboard employees classified as permanent or temporary full-time, and part-time or intermittent as of end of fiscal year 09/30/21. Data for Contractors, Fellows, Trainees, Commissioned Corps (CC), Advisory Council (EI) and ZZ pay plans are not included. Not identified sex and race/ethnicity includes missing values. To maintain confidentiality and protect individual identification from deductive disclosure risk, values of less than four are suppressed for reporting purposes and designated with an asterisk. Total calculations shown may not match those derived from detail data presented due to rounding. Data Sources: nVision report for the pay period that includes 09/30/21; downloaded on 11/5/21.