


NIH Workforce Profile
Fiscal Year 2020, Fourth Quarter
In pursuing the advancement of equity within the NIH workforce, we know that our journey begins with transparency. Through our profiles, we describe the demographic composition of the NIH workforce and utilize the data to investigate potential disparities which may present barriers to equity in the scientific workforce. The ongoing analysis of our workforce data allows us to tell the story of the people here at NIH who work not only to advance biomedical research, but to bring equity to those who serve our country in the pursuit of scientific discovery.
Coming soon: Full FY20 Q4 NIH Workforce for Job Category, Supervisory Status, and Selected Pay Plans by Race and Ethnicity, Sex, and Disability Status
NIH Total Workforce
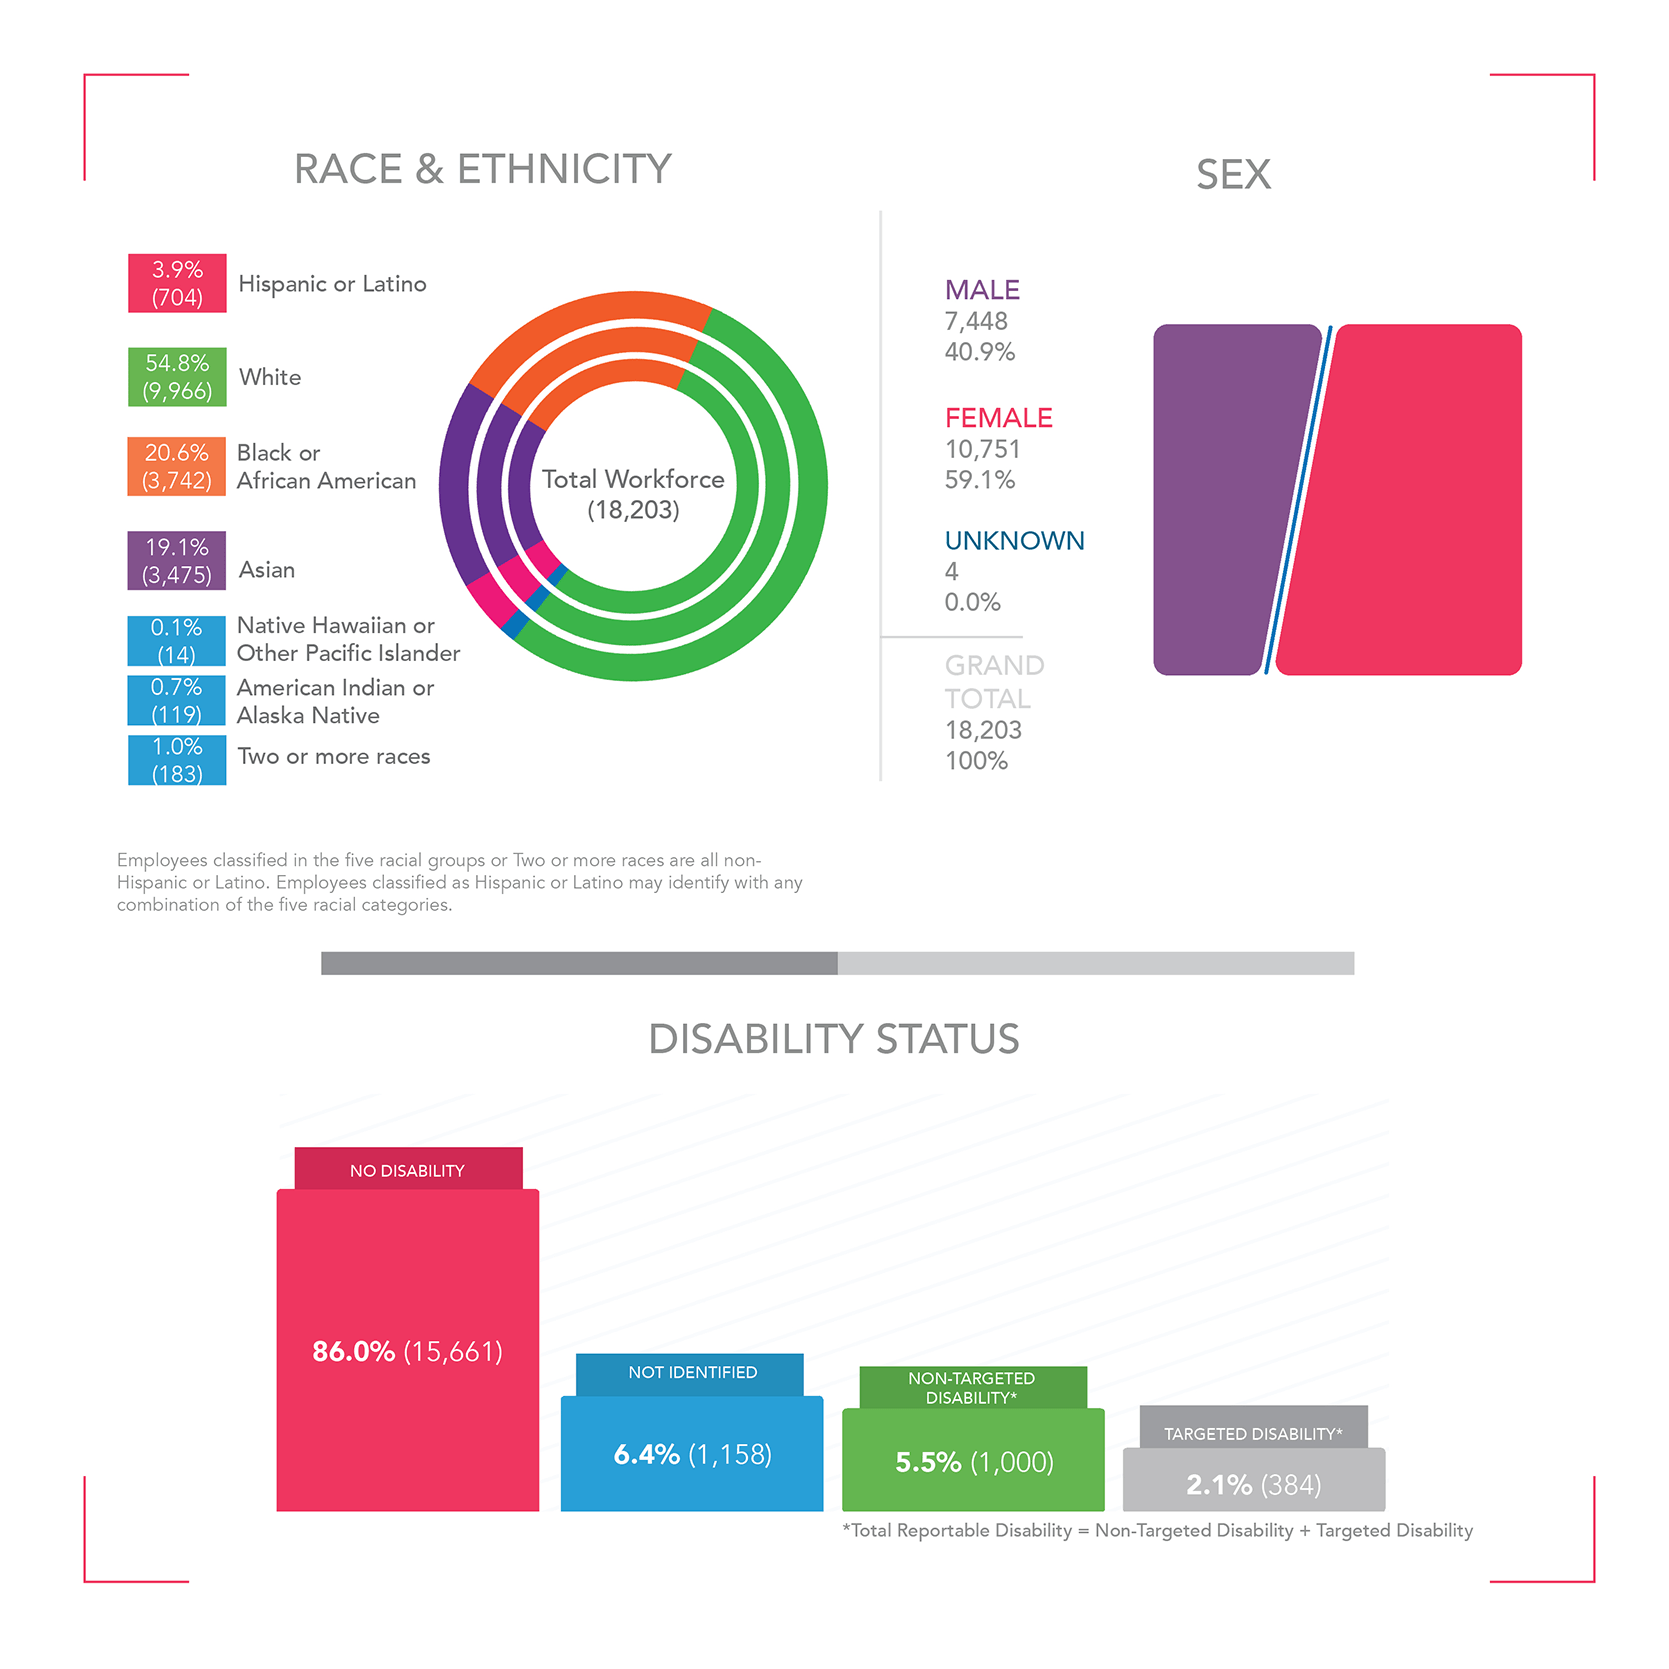
Race & Ethnicity
- 54.8% White (9,966)
- 20.6% Black (3,742)
- 19.1% Asian/Pacific Islander (3,475)
- 3.9% Hispanic (704)
- 1.0% Two or more races (183)
- 0.7% American Indian/Alaskan Native (119)
- 0.1% Native Hawaiian/Pacific Islander (14)
Sex
- Male: 7,448 total men equals 40.9% Men
- Female: 10,751 total women equals 59.1% Women
- Unknown: 4 total equals 0.0%
- Grand total of 18,203 equals 100%
Disability Status
- 6.4% Not Identified (15,661)
- 86.0% No Disability (1,158)
- 5.5% Reportable Disability (1,000)
- 2.1% Targeted Disability (384)
Targeted Disability is a subset of Reportable Disability.
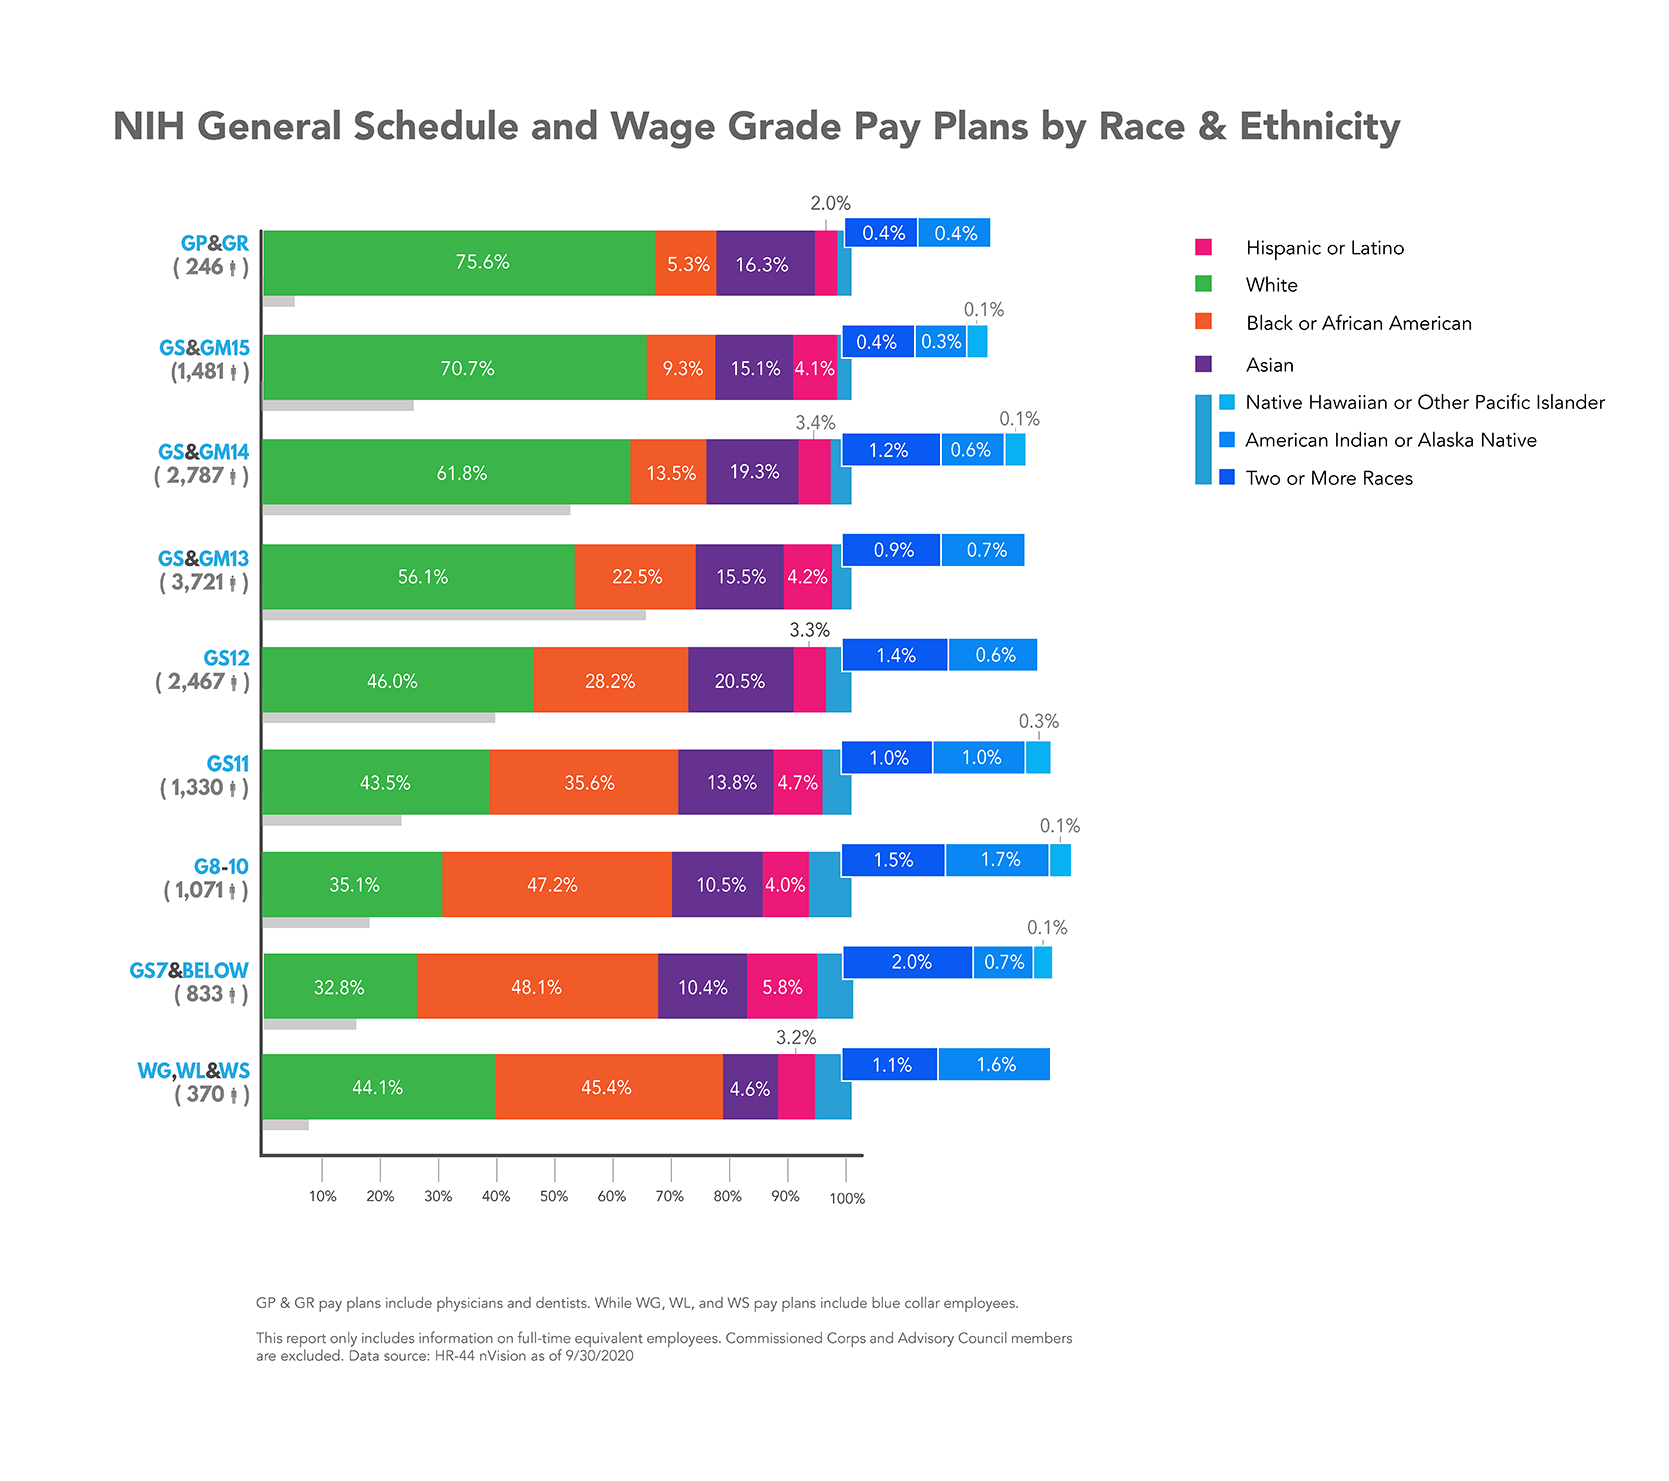
Infographic Summary
GP&GR (Includes physicians and dentists) (246 people); 75.6 White; 5.3% Black; 16.3% Asian; 2% Hispanic; .4% Two or More races; .4% American Indian/Alaska Native.
GS&GM15 (1,481 people); 70.7% White; 9.3% Black; 15.1% Asian; 4.1% Hispanic; .4% Two or More Races; .3% American Indian/Alaska Native; .1% Native American/Pacific Islander.
GS&GM14 (2,787 people) 61.8% White; 13.5% Black; 19.3% Asian; 3.4% Hispanic; 1.2% Two or more races; .6% American Indian/Alaska Native; 0.1% Native American/Pacific Islander.
GS&GM13 (3,721 people) 56.1% White; 22.5% Black; 15.5% Asian; 4.2% Hispanic; .9% Two or More races; .7% American Indian/Alaska Native.
GS12 (2,467 people) 46% White; 28.2% Black; 20.5% Asian; 3.3% Hispanic; 1.4% Two or More races; 0.6% American Indian/Alaska Native.
GS11 (1,330 people) 43.5% White; 35.6% Black; 13.8% Asian; 4.7% Hispanic; 1% Two or more races; 1% American Indian/Alaska Native; 0.3% Native American/Pacific Islander.
GS8-10 (1,071 people) 35.1% White; 47.2% Black; 10.5% Asian; 4% Hispanic; 1.5% Two or more races; 1.7% American Indian/Alaska Native; 0.1% Native American/Pacific Islander.
GS7 and Below (833 people) 32.8% White; 38.1% Black; 10.4% Asian; 5.8% Hispanic; 2% Two or More races; 0.7% American Indian/Alaska Native; 0.3% Native American/Pacific Islander.
WG, WL, and WS (includes blue collar employees) (370 people) 44.1% White; 45.4% Black; 4.6% Asian; 3.2% Hispanic; 1.1% Two or More Races; 1.6% American Indian/Alaska Native.
GP and GR pay plans include physicians and dentists. While WG, WL, and WS pay plans include blue collar employees.
This report only includes information on full-time equivalent employees. Commissioned Corps and Advisory Council members are excluded. Data source: HR-44 nVision as of 9/30/2020.
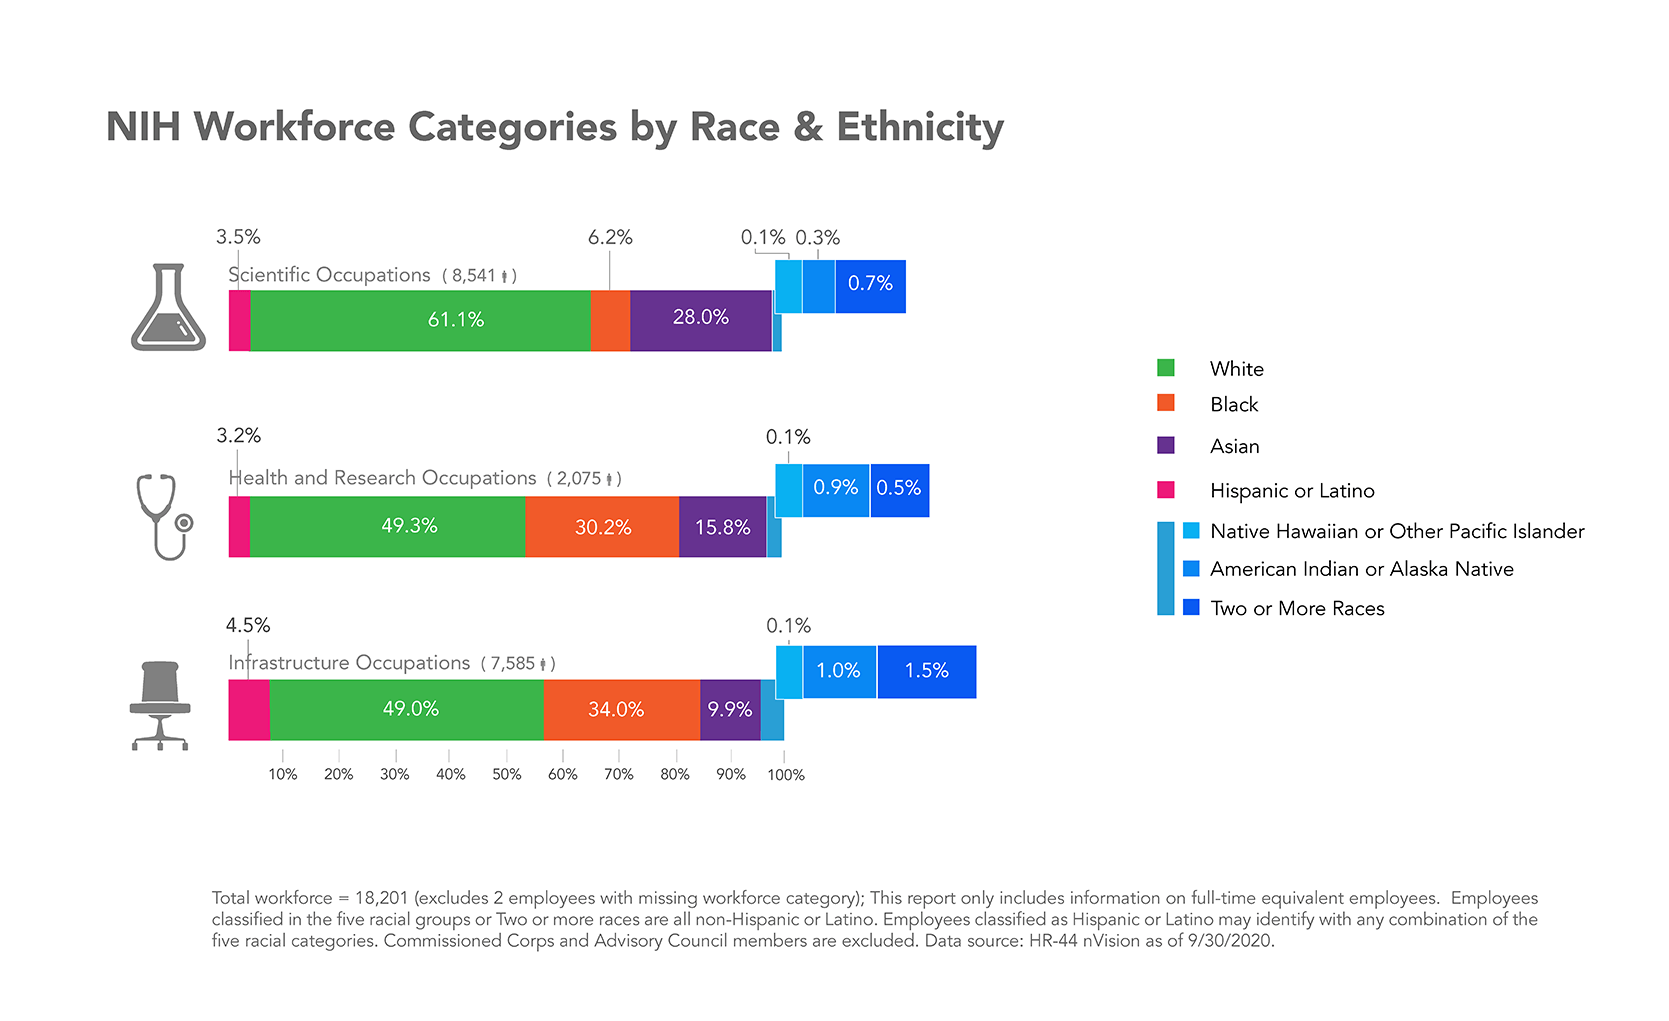
Workforce Categories by Race/Ethnicity includes: Scientific Occupations (8,541people) 61.1% White; 6.2% Black; 28% Asian ; 3.5% Hispanic; 0.7% Two or More Races; 0.3% American Indian/Alaska Native ;0.1% Native Hawaiian/Pacific Islander. Health and Research Occupations (2,075 people) 49.3% White; 30.2% Black; 15.8% Asian ; 3.2% Hispanic; 0.5% Two or More Races; 0.9% American Indian/Alaska Native ;0.1% Native Hawaiian/Pacific Islander. Infrastructure Occupations (7,585 people) 49.0% White; 34% Black; 9.9% Asian ; 4.5% Hispanic; 1.5% Two or More Races; 1.0% American Indian/Alaska Native ;0.1% Native Hawaiian/Pacific Islander
Total Workforce = 18,201 (excludes two employees with missing workforce category); This report only includes information on full-time equivalent employees. Commissioned Corps and Advisory Council members are excluded. Data source: HR-44 nVision as of 9/30/2020.
Data Notes
The National Institutes of Health (NIH) Workforce Demographics for the fourth quarter fiscal year 2020 (Q4 FY 2020) data was retrieved from the nVision Human Resources Database on October 23, 2020 with an As Of date of September 30, 2020. Please note the overall workforce data only includes information on full-time equivalent employees. Employees classified in the five racial groups or Two or more races are all non-Hispanic or Latino. Employees classified as Hispanic or Latino may identify with any combination of the five racial categories. Commissioned Corps (CC), Advisory Council (EI) and ZZ pay plans are excluded.