


NIH Workforce Profile
Fiscal Year 2021, Second Quarter
In pursuing the advancement of equity within the NIH workforce, we know that our journey begins with transparency. Through our profiles, we describe the demographic composition of the NIH workforce and utilize the data to investigate potential disparities which may present barriers to equity in the scientific workforce. The ongoing analysis of our workforce data allows us to tell the story of the people here at NIH who work not only to advance biomedical research, but to bring equity to those who serve our country in the pursuit of scientific discovery.
NIH Total Workforce
NIH Total Workforce
RACE & ETHNICITY: Hispanic or Latino = 724, 3.9%; White = 10038, 54.3%; Black or African American = 3798, 20.6%; Asian = 3586, 19.4%; Native Hawaiian or Other Pacific Islander = 16, 0.1%; American Indian or Alaska Native = 131, 0.7%; Two or more races = 185, 1.0%; Grand Total = 18478, 100.0% Grand Total, American Indian or Alaska Native (alone) 131, 0.71%, Asian (alone), 3586, 19.41%, Black or African American (alone), 3798, 20.55%, Hispanic or Latino, regardless of race(s)724, 3.92%, Native Hawaiian or Pacific Islander (alone), 16, 0.09%, Two or more races, 185, 1.00%, White (alone), 10038, 54.32%, Total Count of Workforce Type, 18478, 100.00%
SEX: FEMALE = 10916, 59.1%; MALE = 7560, 40.9%; OTHER = 2, 0.0%
No Disability = 85.8%; Not Identified = 6.5%; Non-Targeted Disability = 5.6%; Targeted Disability = 2.1%; *Targeted Disability is a subset of reportable disability; Grand Total = 100.0%
Race/Ethnicity
HEALTH AND RESEARCH OCCUPATIONS, American Indian or Alaska Native (alone), 22, 1.03%, Asian (alone), 342, 15.99%, Black or African American (alone) 656, 30.67%, Hispanic or Latino, regardless of race(s) 68, 3.18%, Native Hawaiian or Pacific Islander (alone), 3, 0.14%, Two or more races 11, 0.51%, White (alone), 1037, 48.48%, Total Count of Workforce Type, 2139, 100.00%
INFRASTRUCTURE OCCUPATIONS, American Indian or Alaska Native (alone)77, 1.00%, Asian (alone), 772, 10.05%, Black or African American (alone)2592, 33.73%, Hispanic or Latino, regardless of race(s)356, 4.63%, Native Hawaiian or Pacific Islander (alone), 6, 0.08%, Two or more races 115, 1.50%, White (alone), 3766, 49.01%, Total Count of Workforce Type, 7684, 100.00%
SCIENTIFIC OCCUPATIONS, American Indian or Alaska Native (alone)32, 0.37%, Asian (alone), 2472, 28.56%, Black or African American (alone)550, 6.35%, Hispanic or Latino, regardless of race(s)300, 3.47%, Native Hawaiian or Pacific Islander (alone), 7, 0.08%, Two or more races 59, 0.68%, White (alone), 5235, 60.49%, Total Count of Workforce Type, 8655, 100.00%
Grand Total, American Indian or Alaska Native (alone)131, 0.71%, Asian (alone), 3586, 19.41%, Black or African American (alone)3798, 20.55%, Hispanic or Latino, regardless of race(s)724, 3.92%, Native Hawaiian or Pacific Islander (alone), 16, 0.09%, Two or more races, 185, 1.00%, White (alone), 10038, 54.32%, Total Count of Workforce Type , 18478, 100.00%
Sex
HEALTH AND RESEARCH OCCUPATIONS: FEMALE= 1762, 82.4%; MALE= 377, 17.6%; UNKNOWN= 0, 0.0%; TOTAL = 2139, 100.0%
INFRASTRUCTURE OCCUPATIONS: FEMALE=4730, 61.6%; MALE= 2953, 38.4%, UNKNOWN =1, 0.0%; TOTAL= 7684, 100.0%
SCIENTIFIC OCCUPATIONS: FEMALE = 4424, 51.1%; MALE = 4230, 48.9%; UNKNOWN =1, 0.0%; TOTAL = 8655, 100.0%
Grand Total FEMALE = 10916, 59.1%; MALE= 7560, 40.9%; UNKNOWN = 2, 0.0%, Total = 18478, 100.0%
Disability
INFRASTRUCTURE OCCUPATIONS, No Disability, 6070, 79.0%, Not Identified, 609, 7.9%, Non-Targeted Disability, 725, 9.4%, Targeted Disability, 280, 3.6%, Total Count, 7684, 100.0%
HEALTH AND RESEARCH OCCUPATIONS, No Disability,1888, 88.3%, Not Identified, 135, 6.3%, Non-Targeted Disability, 87, 4.1%, Targeted Disability, 29, 1.4%, Total Count, 2139, 100.0%
SCIENTIFIC OCCUPATIONS, No Disability,7887, 91.1%, Not Identified, 466, 5.4%, Non-Targeted Disability, 216, 2.5%, Targeted Disability, 86, 1.0%, Total Count, 8655, 100.0%
Grand Total, No Disability,15845, 85.8%, Not Identified, 1210, 6.5%, Non-Targeted Disability, 1028, 5.6%, Targeted Disability, 395, 2.1%, Total Count, 18478, 100.0%
Race/Ethnicity
SCIENTIFIC OCCUPATIONS, White, 5235, 60.49%, Black or African American, 550, 6.35%, Asian, 2472, 28.56%, Hispanic or Latino, 300, 3.47%, Two or more races, 59, 0.68%, American Indian or Alaska Native, 32, 0.37%, Native Hawaiian or Other Pacific Islander, 7, 0.08%, Total 8655
Supervisor, White, 1462, 74.74%, Black or African American, 89, 4.55%, Asian, 328, 16.77%, Hispanic or Latino, 66, 3.37%, Two or more races, 6, 0.31%, American Indian or Alaska Native, 5, 0.26%, Native Hawaiian or Other Pacific Islander, 0, 0.00%, Total 1956
Non-Supervisor, White, 3773, 56.32%, Black or African American, 461, 6.88%, Asian, 2144, 32.00%, Hispanic or Latino, 234, 3.49%, Two or more races, 53, 0.79%, American Indian or Alaska Native, 27, 0.40%, Native Hawaiian or Other Pacific Islander, 7, 0.10%, Total 6699
HEALTH AND RESEARCH OCCUPATIONS, White, 1037, 48.48%, Black or African American, 656, 30.67%, Asian, 342, 15.99%, Hispanic or Latino, 68, 3.18%, Two or more races, 11, 0.51%, American Indian or Alaska Native, 22, 1.03%, Native Hawaiian or Other Pacific Islander, 3, 0.14%, Total 2139
Supervisor, White, 92, 65.71%, Black or African American, 25, 17.86%, Asian, 18, 12.86%, Hispanic or Latino, 3, 2.14%, Two or more races, 1, 0.71%, American Indian or Alaska Native, 1, 0.71%, Native Hawaiian or Other Pacific Islander, 0, 0.00%, Total 140
Non-Supervisor, White, 945, 47.27%, Black or African American, 631, 31.57%, Asian, 324, 16.21%, Hispanic or Latino, 65, 3.25%, Two or more races, 10, 0.50%, American Indian or Alaska Native, 21, 1.05%, Native Hawaiian or Other Pacific Islander, 3, 0.15%, Total 1999
INFRASTRUCTURE OCCUPATIONS, White, 3766, 49.01%, Black or African American, 2592, 33.73%, Asian, 772, 10.05%, Hispanic or Latino, 356, 4.63%, Two or more races, 115, 1.50%, American Indian or Alaska Native, 77, 1.00%, Native Hawaiian or Other Pacific Islander, 6, 0.08%, Total 7684
Supervisor, White, 799, 61.84%, Black or African American, 310, 23.99%, Asian, 111, 8.59%, Hispanic or Latino, 48, 3.72%, Two or more races, 10, 0.77%, American Indian or Alaska Native, 14, 1.08%, Native Hawaiian or Other Pacific Islander, 0, 0.00%, Total 1292
Non-Supervisor, White, 2967, 46.42%, Black or African American, 2282, 35.70%, Asian, 661, 10.34%, Hispanic or Latino, 308, 4.82%, Two or more races, 105, 1.64%, American Indian or Alaska Native, 63, 0.99%, Native Hawaiian or Other Pacific Islander, 6, 0.09%, Total 6392
Sex
HEALTH AND RESEARCH OCCUPATIONS, FEMALE, 1762, 82.40%, MALE, 377, 17.60%, OTHER, 0, 0.00%, TOTAL, 2139
Non-Supervisor, FEMALE, 1651, 82.60%, MALE, 348, 17.40%, OTHER, 0, 0.00%, TOTAL, 1999
Supervisor, FEMALE, 111, 79.30%, MALE, 29, 20.70%, OTHER, 0, 0.00%, TOTAL, 140
INFRASTRUCTURE OCCUPATIONS, FEMALE, 4730, 61.60%, MALE, 2953, 38.40%, OTHER, 1, 0.00%, TOTAL, 7684
Non-Supervisor, FEMALE, 4002, 62.60%, MALE, 2389, 37.40%, OTHER, 1, 0.00%, TOTAL, 6392
Supervisor, FEMALE, 728, 56.30%, MALE, 564, 43.70%, OTHER, 0, 0.00%, TOTAL, 1292
SCIENTIFIC OCCUPATIONS, FEMALE, 4424, 51.10%, MALE, 4230, 48.90%, OTHER, 1, 0.00%, TOTAL, 8655
Non-Supervisor, FEMALE, 3622, 54.10%, MALE, 3076, 45.90%, OTHER, 1, 0.00%, TOTAL, 6699
Supervisor, FEMALE, 802, 41.00%, MALE, 1154, 59.00%, OTHER, 0, 0.00%, TOTAL, 1956
Disability
INFRASTRUCTURE OCCUPATIONS, No Disability, 6070, 79.00%, Not Identified, 609, 7.90%, Non-Targeted Disability, 725, 9.40%, Targeted Disability, 280, 3.60%, Total, 7684
Non-Supervisor, No Disability, 4939, 77.30%, Not Identified, 545, 8.50%, Non-Targeted Disability, 658, 10.30%, Targeted Disability, 250, 3.90%, Total, 6392
Supervisor, No Disability, 1131, 87.50%, Not Identified, 64, 5.00%, Non-Targeted Disability, 67, 5.20%, Targeted Disability, 30, 2.30%, Total, 1292
HEALTH AND RESEARCH OCCUPATIONS, No Disability, 1888, 88.30%, Not Identified, 135, 6.30%, Non-Targeted Disability, 87, 4.10%, Targeted Disability, 29, 1.40%, Total, 2139
Non-Supervisor, No Disability, 1762, 88.10%, Not Identified, 129, 6.50%, Non-Targeted Disability, 80, 4.00%, Targeted Disability, 28, 1.40%, Total, 1999
Supervisor, No Disability, 126, 90.00%, Not Identified, 6, 4.30%, Non-Targeted Disability, 7, 5.00%, Targeted Disability, 1, 0.70%, Total, 140
SCIENTIFIC OCCUPATIONS, No Disability, 7887, 91.10%, Not Identified, 466, 5.40%, Non-Targeted Disability, 216, 2.50%, Targeted Disability, 86, 1.00%, Total, 8655
Non-Supervisor, No Disability, 6104, 91.10%, Not Identified, 379, 5.70%, Non-Targeted Disability, 149, 2.20%, Targeted Disability, 67, 1.00%, Total, 6699
Supervisor, No Disability, 1783, 91.20%, Not Identified, 87, 4.40%, Non-Targeted Disability, 67, 3.40%, Targeted Disability, 19, 1.00%, Total, 1956

Race/Ethnicity
AD = American Indian or Alaska Native (alone) 1, 1.09%, Asian (alone) 13, 14.13%, Black or African American (alone) 21, 22.83%, Hispanic or Latino 3, 3.26%, Native Hawaiian or Pacific Islander (alone) 0, 0.00%, Two or more races, 0, 0.00%, White (alone), 54, 58.70%, Total 92
ES, EX, SL, ST = American Indian or Alaska Native (alone) 0, 0.00%, Asian (alone) 4, 8.00%, Black or African American (alone) 8, 16.00%, Hispanic or Latino 0, 0.00%, Native Hawaiian or Pacific Islander (alone), 0, 0.00%, Two or more races, 0, 0.00%, White (alone), 38, 76.00%, Total 50
RF = American Indian or Alaska Native (alone) 1, 0.07%, Asian (alone) 243, 18.15%, Black or African American (alone) 40, 2.99%, Hispanic or Latino 48, 3.58%, Native Hawaiian or Pacific Islander (alone), 0, 0.00%, Two or more races, 4, 0.30%, White (alone), 1003, 74.91%, Total 1339
RG = American Indian or Alaska Native (alone) 11, 0.45%, Asian (alone) 963, 39.65%, Black or African American (alone) 71, 2.92%, Hispanic or Latino 85, 3.50%, Native Hawaiian or Pacific Islander (alone), 4, 0.16%, Two or more races, 16, 0.66%, White (alone), 1279, 52.66%, Total 2429
RS = American Indian or Alaska Native (alone) 0, 0.00%, Asian (alone) 3, 13.64%, Black or African American (alone) 0, 0.00%, Hispanic or Latino 1, 4.55%, Native Hawaiian or Pacific Islander (alone), 0, 0.00%, Two or more races, 0, 0.00%, White (alone),18, 81.82%, Total 22
Sex
AD, FEMALE, 68, 73.91%, MALE, 24, 26.09%, OTHER, 0, 0.00%, 92, 100.00%
ES, EX, SL, ST, FEMALE, 28, 56.00%, , MALE, 22, 44.00%, OTHER, 0, 0.00%, Total 50, 100.00%
RF, FEMALE, 439, 32.79%, MALE, 900, 67.21%, OTHER, 0, 0.00%, Total 1339, 100.00%
RG, FEMALE, 1028, 42.32%, MALE, 1400, 57.64%, OTHER, 1, 0.04%, Total 2429, 100.00%
RS, FEMALE, 4, 18.18%, MALE, 18, 81.82%, OTHER, 0, 0.00%, Total 22, 100.00%
Disability
AD, No Disability, 80, 86.96%, Not Identified, 10, 10.87%, Non-Targeted Disability, 2, 2.17%, Targeted Disability 0, 0.00%, Total Count, 92, 100.00%
ES, EX, SL, ST, No Disability, 46, 92.00%, Not Identified, 1, 2.00%, Non-Targeted Disability, 2, 4.00%, Targeted Disability 1, 2.00%, Total Count, 50, 100.00%
RF, No Disability, 1227, 91.64%, Not Identified, 55, 4.11%, Non-Targeted Disability, 46, 3.44%, Targeted Disability 11, 0.82%, Total Count, 1339, 100.00%
RG, No Disability, 2223, 91.52%, Not Identified, 174, 7.16%, Non-Targeted Disability, 23, 0.95%, Targeted Disability 9, 0.37%, Total Count, 2429, 100.00%
RS, No Disability, 17, 77.27%, Not Identified, 3, 13.64%, Non-Targeted Disability, 0, 0.00%, Targeted Disability 2, 9.09%, Total Count, 22, 100.00%
Race/Ethnicity
GP, GR, American Indian or Alaska Native (alone), 1, 0.39%, Asian (alone), 42, 16.41%, Black or African American (alone), 13, 5.08%, Hispanic or Latino, regardless of race(s), 5, 1.95%, Native Hawaiian or Pacific Islander (alone), 0, 0.00%, Two or more races, 2, 0.78%, White (alone), 193, 75.39%, Total, 256
GS & GM 13, American Indian or Alaska Native (alone), 30, 0.78%, Asian (alone), 615, 15.99%, Black or African American (alone), 880, 22.87%, Hispanic or Latino, regardless of race(s), 164, 4.26%, Native Hawaiian or Pacific Islander (alone), 1, 0.03%, Two or more races, 40, 1.04%, White (alone), 2117, 55.03%, Total, 3847
GS & GM 14, American Indian or Alaska Native (alone), 16, 0.56%, Asian (alone), 564, 19.76%, Black or African American (alone), 382, 13.38%, Hispanic or Latino, regardless of race(s), 97, 3.40%, Native Hawaiian or Pacific Islander (alone), 3, 0.11%, Two or more races, 32, 1.12%, White (alone), 1760, 61.67%, Total, 2854
GS & GM 15, American Indian or Alaska Native (alone), 7, 0.46%, Asian (alone), 246, 16.06%, Black or African American (alone), 151, 9.86%, Hispanic or Latino, regardless of race(s), 64, 4.18%, Native Hawaiian or Pacific Islander (alone), 1, 0.07%, Two or more races, 6, 0.39%, White (alone), 1057, 68.99%, Total, 1532
GS 11, American Indian or Alaska Native (alone), 14, 1.04%, Asian (alone), 190, 14.16%, Black or African American (alone), 500, 37.26%, Hispanic or Latino, regardless of race(s), 55, 4.10%, Native Hawaiian or Pacific Islander (alone), 4, 0.30%, Two or more races, 10, 0.75%, White (alone), 569, 42.40%, Total, 1342
GS 12, American Indian or Alaska Native (alone), 21, 0.84%, Asian (alone), 491, 19.72%, Black or African American (alone), 698, 28.03%, Hispanic or Latino, regardless of race(s), 93, 3.73%, Native Hawaiian or Pacific Islander (alone), 1, 0.04%, Two or more races, 38, 1.53%, White (alone), 1148, 46.10%, Total, 2490
GS 7 & Below, American Indian or Alaska Native (alone), 8, 0.99%, Asian (alone), 78, 9.64%, Black or African American (alone), 388, 47.96%, Hispanic or Latino, regardless of race(s), 51, 6.30%, Native Hawaiian or Pacific Islander (alone), 1, 0.12%, Two or more races, 14, 1.73%, White (alone), 269, 33.25%, Total, 809
GS 8 to 10, American Indian or Alaska Native (alone), 16, 1.52%, Asian (alone), 115, 10.91%, Black or African American (alone), 488, 46.30%, Hispanic or Latino, regardless of race(s), 46, 4.36%, Native Hawaiian or Pacific Islander (alone), 1, 0.09%, Two or more races, 18, 1.71%, White (alone), 370, 35.10%, Total, 1054
WG, WL, WS, American Indian or Alaska Native (alone), 5, 1.38%, Asian (alone), 19, 5.25%, Black or African American (alone), 158, 43.65%, Hispanic or Latino, regardless of race(s), 12, 3.31%, Native Hawaiian or Pacific Islander (alone), 0, 0.00%, Two or more races, 5, 1.38%, White (alone), 163, 45.03%, Total, 362
Sex
GP, GR, FEMALE, 134, 52.34%, MALE, 122, 47.66%, OTHER, 0, 0.00%, TOTAL, 256
GS & GM 13, FEMALE, 2633, 68.44%, MALE, 1213, 31.53%, OTHER, 1, 0.03%, TOTAL, 3847
GS & GM 14, FEMALE, 1726, 60.48%, MALE, 1128, 39.52%, OTHER, 0, 0.00%, TOTAL, 2854
GS & GM 15, FEMALE, 871, 56.85%, MALE, 661, 43.15%, OTHER, 0, 0.00%, TOTAL, 1532
GS 11, FEMALE, 1012, 75.41%, MALE, 330, 24.59%, OTHER, 0, 0.00%, TOTAL, 1342
GS 12, FEMALE, 1706, 68.51%, MALE, 784, 31.49%, OTHER, 0, 0.00%, TOTAL, 2490
GS 7 & Below, FEMALE, 500, 61.80%, MALE, 309, 38.20%, OTHER, 0, 0.00%, TOTAL, 809
GS 8 to 10, FEMALE, 735, 69.73%, MALE, 319, 30.27%, OTHER, 0, 0.00%, TOTAL, 1054
WG, WL, WS, FEMALE, 32, 8.84%, MALE, 330, 91.16%, OTHER, 0, 0.00%, TOTAL, 362
Disability
GP, GR, No Disability, 232, 90.63%, Not Identified, 17, 6.64%, Non-Targeted Disability, 6, 2.34%, Targeted Disability, 1, 0.39%, Total, 256
GS & GM 13, No Disability, 3271, 85.03%, Not Identified, 256, 6.65%, Non-Targeted Disability, 247, 6.42%, Targeted Disability, 73, 1.90%, Total, 3847
GS & GM 14, No Disability, 2540, 89.00%, Not Identified, 141, 4.94%, Non-Targeted Disability, 127, 4.45%, Targeted Disability, 46, 1.61%, Total, 2854
GS & GM 15, No Disability, 1404, 91.64%, Not Identified, 45, 2.94%, Non-Targeted Disability, 61, 3.98%, Targeted Disability, 22, 1.44%, Total, 1532
GS 11, No Disability, 1073, 79.96%, Not Identified, 114, 8.49%, Non-Targeted Disability, 116, 8.64%, Targeted Disability, 39, 2.91%, Total, 1342
GS 12, No Disability, 2094, 84.10%, Not Identified, 184, 7.39%, Non-Targeted Disability, 153, 6.14%, Targeted Disability, 59, 2.37%, Total, 2490
GS 7 & Below, No Disability, 520, 64.28%, Not Identified, 104, 12.86%, Non-Targeted Disability, 120, 14.83%, Targeted Disability, 65, 8.03%, Total, 809
GS 8 to 10, No Disability, 808, 76.66%, Not Identified, 86, 8.16%, Non-Targeted Disability, 109, 10.34%, Targeted Disability, 51, 4.84%, Total, 1054
WG, WL, WS, No Disability, 310, 85.64%, Not Identified, 20, 5.52%, Non-Targeted Disability, 16, 4.42%, Targeted Disability, 16, 4.42%, Total, 362
Race/Ethnicity
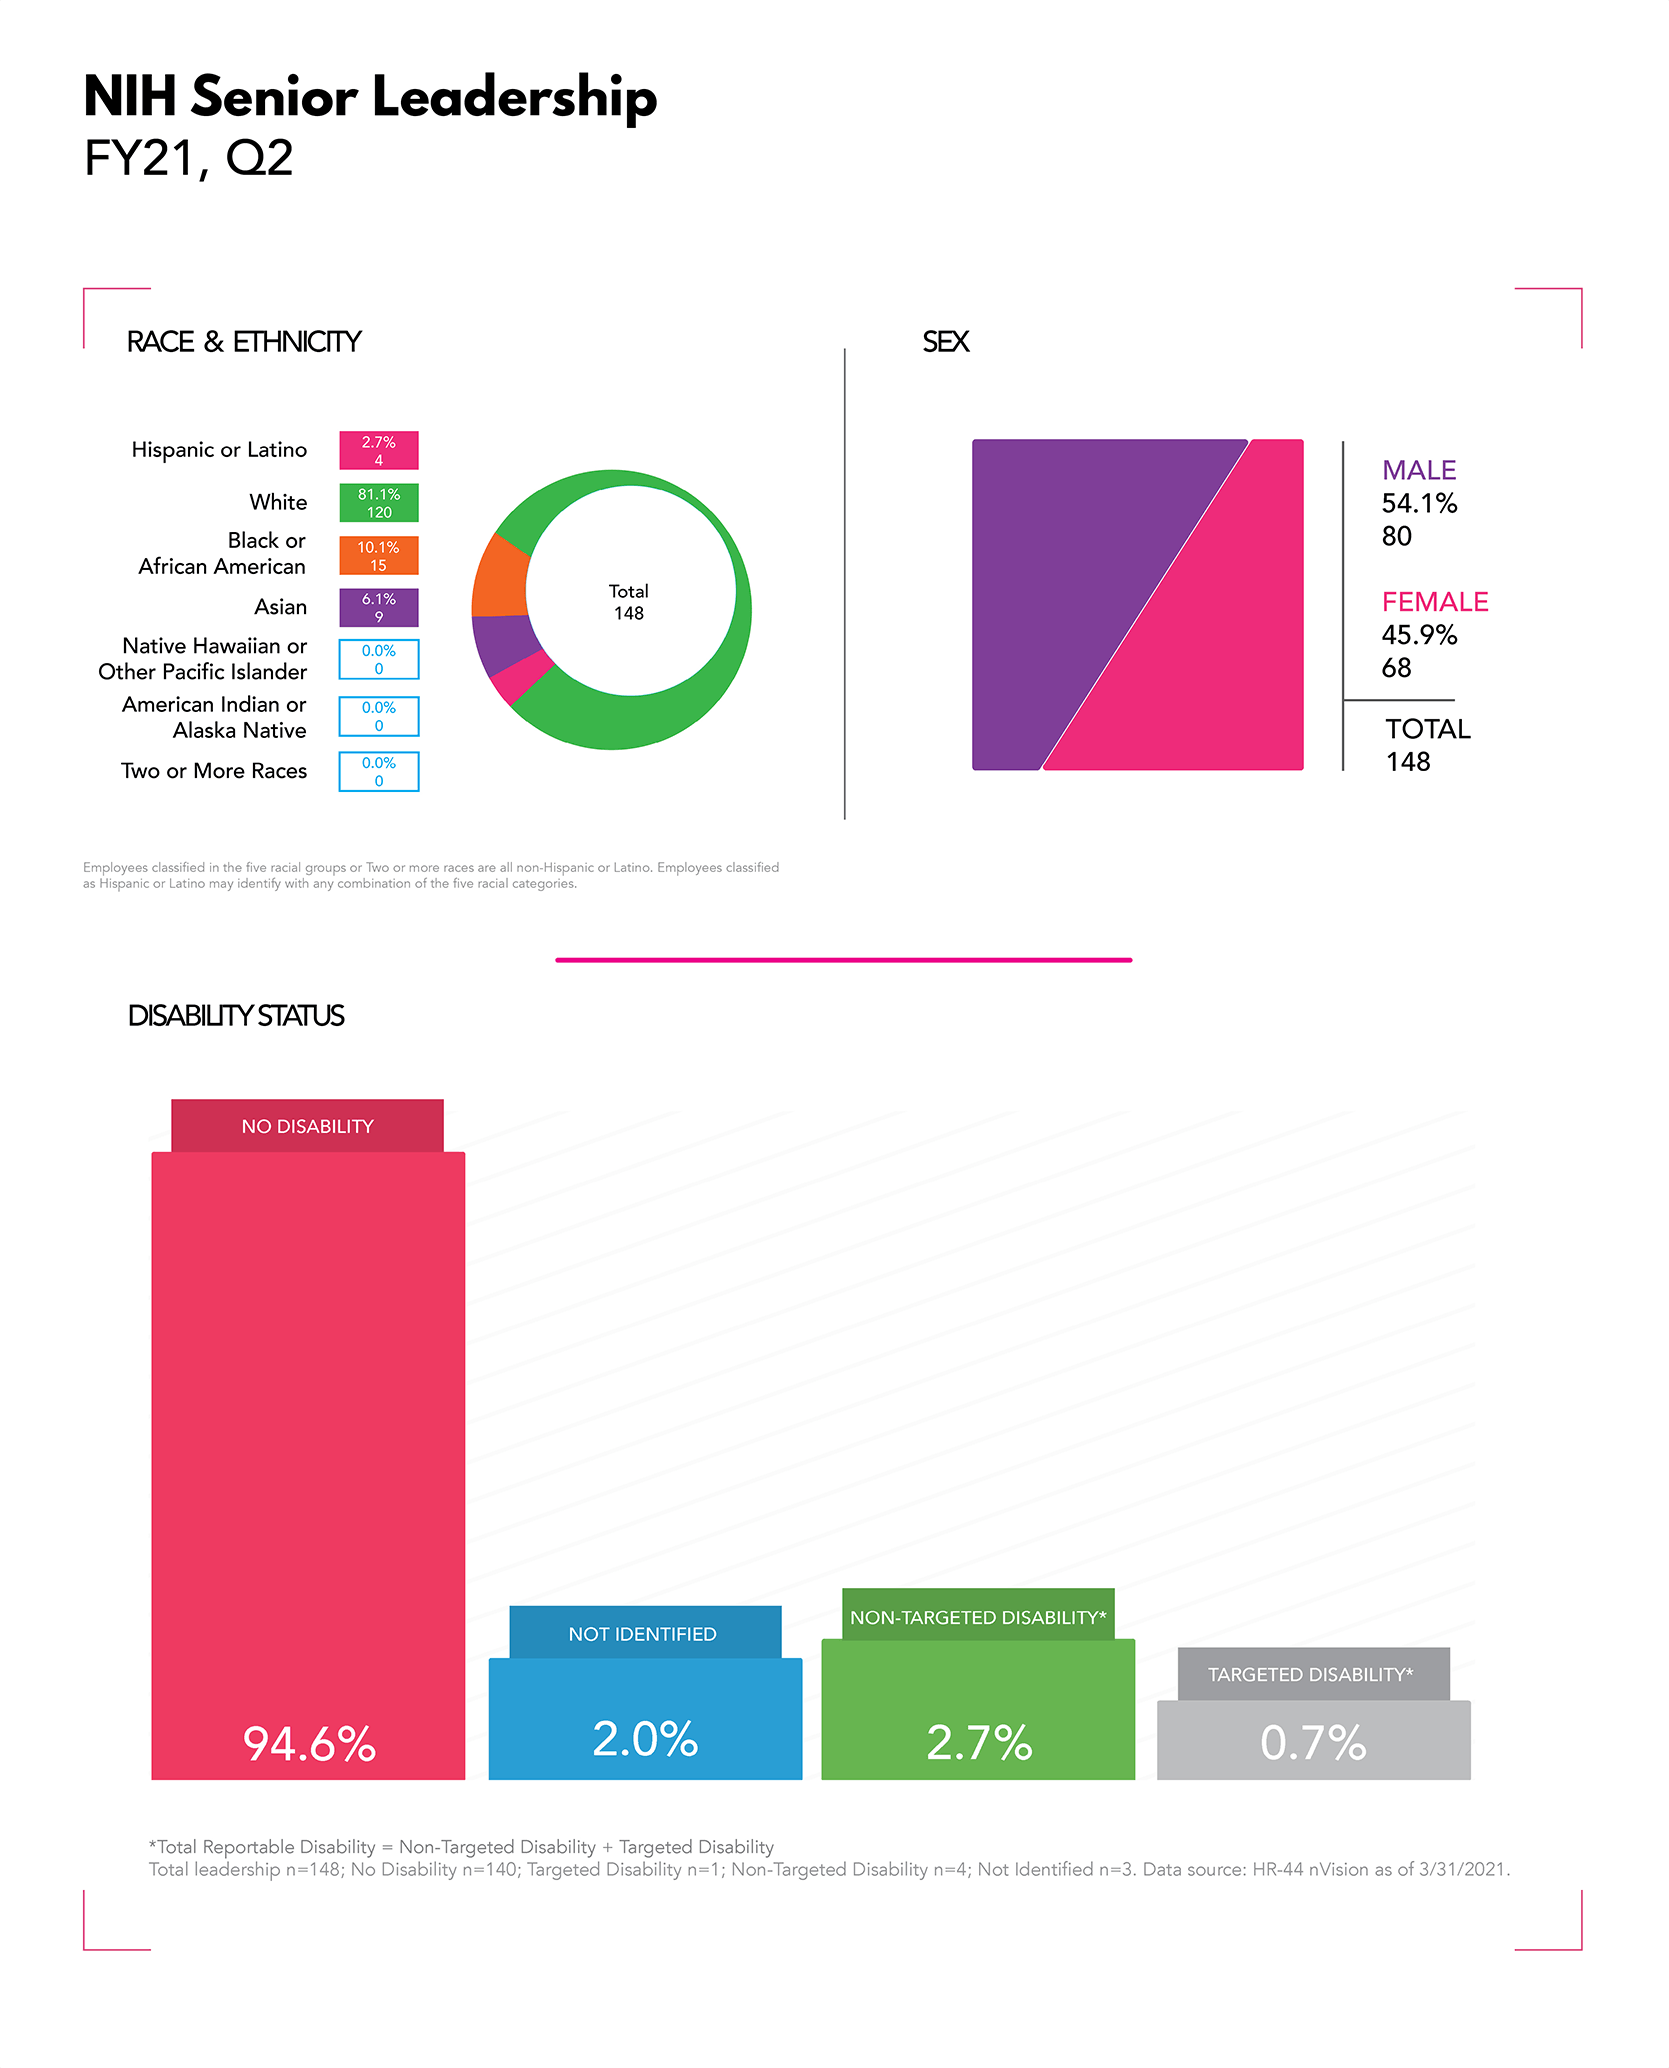
Hispanic or Latino, 2.7%, 4; White, 81.1%, 120; Black or African American, 10.1%, 15; Asian, 6.1%, 9; Grand Total, 100.0%, 148
Sex
FEMALE, 68, 45.9%; MALE, 80, 54.1%; Grand Total, 148, 100.0%
Disability
No Disability, 140, 94.6%; Not Identified, 3, 2.0%; Non-Targeted Disability, 4, 2.7%; Targeted Disability, 1, 0.7%; Grand Total, 148, 100.0%
Data Notes
The National Institutes of Health (NIH) Workforce Demographics for the second quarter fiscal year 2021 (Q2 FY 2021) data was retrieved from the nVision Human Resources Database on April 2, 2021 with an As Of date of March 31, 2021. Please note the overall workforce data only includes information on full-time equivalent employees. Employees classified in the five racial groups or Two or more races are all non-Hispanic or Latino. Employees classified as Hispanic or Latino may identify with any combination of the five racial categories. Commissioned Corps (CC), Advisory Council (EI) and ZZ pay plans are excluded.
*Targeted disabilities are defined as disabilities that the government has, for several decades, emphasized in hiring because they pose the greatest barriers to employment, such as blindness, deafness, paralysis, convulsive disorders, and mental illnesses, among others.
An individual with a disability is defined on the SF 256 as, “a person who (1) has a physical or mental impairment which substantially limits one or more major life activities; (2) has a record of such an impairment; or (3) is regarded as having such an impairment.” This definition is provided by the Rehabilitation Act of 1973, as amended (29 U.S.C. 701, et seq.).
Source: https://www.eeoc.gov